Time Series Data Management System   (TSDMS)

TSDMS Solutions Blog Pricing About Support


NI DIAdem Tutorial - VIEW Panel

NI DIAdem is software for measurement data aggregation, inspection, analysis, and reporting.   The Time Series Data Management System (TSDMS) is built on DIAdem, harnessing DIAdem's powerful features into a seemless application that is easier to use than DIAdem alone.   This tutorial is intended to assist a beginner on how to use the DIAdem VIEW panel tools alone, without the assistance of the TSDMS.  


View

The DIAdem VIEW panel allows you to visually inspect and graphically analyze data loaded into the Data Portal.   Channel Tables allow you to see the contents of channel individual values in tabular format.   The 2D Axis System enables inspection of plotted channel data.   The layout in VIEW is flexable, allowing you to view a channel table in one section, and one or more 2D Axis System plots in an other.   Other types of interactive visualization tools are available, including Bode, Polar, Orbit, Shaft Centerline, Birds Eye View, Contour, Cascade, Map, Graphic, Video, and Textbox, depending on the type of channel you have.  

If video was recorded simultaneously with data, you can use VIEW to interactively inspect the data and visually see the video content at that point in time.   Videos and data are synchronized using the data time channel, and the time reference data in the video.  

Load the file 'Example.tdm' in order to follow this tutorial.

The VIEW Panel GUI

The VIEW toolbar is always visible when the VIEW panel is selected, along with the Group Bar where you can select worksheet partitions.   The Axis Toolbar is only visible when a '2D Axis System' (or other axis system) is assigned to a worksheet area.  

NI DIAdem Data Portal


Scroll Cursor Range

Load the file 'Example.tdm' in order to follow this tutorial.

Activate the VIEW panel and create a new layout with the 'File', 'New' menu options.   Choose the 'Regular Worksheet Partitions' group bar and then the option 'Two Areas'.  

ANALYSIS - FFT (One Time Signal) power spectral density (PSD)

In the Data Portal, expand the channel group 'Example', and then select the channel 'Time' first, and then the channel 'RPM'.   Drag and drop the two selected channels into the VIEW sheet upper area, and then choose the '2D Axis System' from the popup menu that appears.   Activate the VIEW toolbar 'Free Cursor'.   Activate the VIEW toolbar 'Band Cursor'.   The 'Band Cursor' will appear as two vertical lines, with the area on either side of the lines shaded.   The left band cursor line will have a small blue square in the vertical center of the line.   Hover your mouse over each line, and observe how the mouse cursor changes from a four-way arrow cursor, to a two-way left/right cursor.   A popup information box will appear as well, showing you the corrdinates of the band cursor line.   With your mouse over the band cursor line and the mouse cursor appearing as a two-way left/right arrow cursor, click and hold the left mouse button on line, and then move the lines individually to approximately the positions shown in the image below.  

DIAdem VIEW band cursor

DIAdem VIEW band cursor

Position your mouse cursor in the center between the band cursor and then click and hold the left mouse button.   Move your mouse left and right and observe how the two band cursor lines move to follow the mouse cursor.   Position the band cursor so it appears as shown in the image below.  

DIAdem VIEW band cursor

The 'Time' and 'RPM' channels should still be selected in the Data Portal (if they are not, select the 'Time' channel, and then the 'RPM' channel).   Drag and drop the channels into the lower VIEW sheet area, and select '2D Axis System' when the popup menu appears.   The two channels will be plotted in the lower VIEW sheet area, and the band cursor will be configured exactly as it was in the upper VIEW sheet area.   Note that the lower VIEW sheet area was configured exactly the same as the upper area because the VIEW sheet toolbar settings are relative to each VIEW sheet.   If you created a new VIEW sheet and configured a different cursor option such as 'Frame Cursor' or 'Free Cursor', those setting would be unique to the actively displayed VIEW sheet.  

DIAdem VIEW band cursor

The lower VIEW sheet area should be currently active.   Click on the area toolbar labeled 'Scroll Cursor Range'.   The lower 2D Axis System will immediately zoom into the X-axis range specified by the Band Cursor.   Note that the Band Cursor is no longer visible in the lower VIEW sheet area.  

DIAdem VIEW band cursor

Click in the upper VIEW sheet area between the two Band Cursors.   While holding the left mouse button down, your mouse left and right causing the Band Cursor in the upper VIEW area to scroll along the curve, and causing the 2D Axis System in the lower VIEW sheet to scroll as well (but with a zoomed in view of the signal).   This scrolling of the lower 2D Axis System in conjuction with the Band Cursor in the upper VIEW area is called 'Scroll Cursor Range'.  

Try changing the positions of the Band Cursor in the upper VIEW area and observe what happens in the lower VIEW area.  

The video below will demonstrate the latter part of the 'Scroll Cursor Range'.  

The Descriptive Statistics Within Band Cursor tutorial demonstrates how to get the statistics for the channel values between the band cursor lines.  


Axis Scaling

Load the file 'Example.tdm' in order to follow this tutorial.

Activate the VIEW panel and create a new layout with the 'File', 'New' menu options.   Choose the 'Regular Worksheet Partitions' group bar and then the option 'Two Areas'.  

ANALYSIS - FFT (One Time Signal) power spectral density (PSD)

In the Data Portal, expand the channel group 'Example', and then select the channel 'Time' first, and then the channel 'RPM'.   Drag and drop the two selected channels into the VIEW sheet upper area, and then choose the '2D Axis System' from the popup menu that appears.  

The X-axis may be changed to a logarithmic scale.   Right click in the center of the 2D Axis System and choose the menu options 'X-Axis', 'X-Axis [Log.]'.   Reset the X-Axis back to 'X-Axis [Linear]' following the same procedure.  

DIAdem VIEW band cursor

Open the '2D Axis System' dialog by double clicking in the center of the 2D Axis System in the upper VIEW area, or right click and choose the popup menu option 'Settings...'.   In the lower section of the '2D Axis System' dialog, change the 'Scaling' option from to 'Manually over all curves'.   Note that the 'Scaling' is relative to the Y-axis, or the channel 'RPM'.   The 'Begin:' and 'End:' limits should be set to the minimum and maximum values of the channel 'RPM', respectively.   Change the 'Begin:' to '4000.0' and then click the 'OK' button to accept the change and close the dialog.  

DIAdem VIEW band cursor

DIAdem VIEW band cursor

You may also change the Y-axis scaling to logarithmic, and you can configure it with various options for the display of multiple channels.  

Activate the VIEW panel and create a new layout with the 'File', 'New' menu options.   Choose the 'Regular Worksheet Partitions' group bar and then the option 'Four Areas'.   In the Data Portal, expand the channel group 'Example', and then select the channel 'Time' first, and then the channels 'Speed' and 'RPM'.   Drag and drop the three selected channels into every the VIEW sheet upper left area, and then choose the '2D Axis System' from the popup menu that appears.   Repeat this for the remaining three VIEW sheet areas.  

DIAdem VIEW band cursor

In the VIEW sheet top left area, select the 2D Axis System toolbar option 'Y-Axis', and then the option 'Y-Axis[%]'.   In the VIEW sheet top right area, select the 2D Axis System toolbar option 'Y-Axis', and then the option 'Y-Axis[log.]'.   In the VIEW sheet bottom left area, select the 2D Axis System toolbar option 'Y-Axis', and then the option 'n Systems[linear]'.   In the VIEW sheet bottom right area, select the 2D Axis System toolbar option 'Y-Axis', and then the option 'n Y-Axes [Linear]'.  

DIAdem VIEW band cursor

DIAdem VIEW band cursor


Curve Formatting

Load the file 'Example.tdm' in order to follow this tutorial.

2D Axis System Curve Formatting

Activate the VIEW panel and create a new layout with the 'File', 'New' menu options.   Choose the 'Regular Worksheet Partitions' group bar and then the option 'Four Areas'.   In the Data Portal, expand the channel group 'Example', and then select the channel 'Time' first, and then the channels 'Speed' and 'RPM'.   Drag and drop the three selected channels into every the VIEW sheet upper left area, and then choose the '2D Axis System' from the popup menu that appears.   Repeat this for the remaining three VIEW sheet areas.   Click here to see how the VIEW sheet should appear.   Use the 2D Axis System 'Y-Axis' toolbar to configure the Y-Axis for each of the four VIEW sheet areas as 'n Systems [linear]'.  

The '2D Axis System' settings dialog will appear if you either double click inside a 2D Axis System chart, or right click on it and choose the popup menu option 'Settings...'.  '

NI DIAdem VIEW 2D Axis System curve formatting

The upper section of the dialog labeled 'Curve List' will list any curves assigned to the 2D Axis System.   You may use the toolbar within the Curve List frame to edit, add, and delete curves.   Within a specific Curve List Item, the column 'No.' identifies the curve, and the checkbox enables or disables the display of the curve.   The column 'Type' allows you to select between a curve type of 'Line', 'Spikes', and 'Stair curve'.  

NI DIAdem VIEW 2D Axis System curve formatting

The column 'Color' allows you to change the color assigned to the curve.  

NI DIAdem VIEW 2D Axis System curve formatting

Clicking on the 'Properties' button for a curve loads the 'Curve Properties' dialog.   Click on the 'Markers' tab to activate it, and then change the 'Marker style:' from 'None' to 'Square'.   Click the 'OK' button to close the 'Curve Properties' and then again to close the '2D Axis System' dialog.  

NI DIAdem VIEW 2D Axis System curve formatting

NI DIAdem VIEW 2D Axis System curve formatting

The curve for the channel 'Speed' appears as a thick red line.   This is because the channel has many data values, causing the overlapping marker to appear as a line.  

NI DIAdem VIEW 2D Axis System curve formatting

NI DIAdem VIEW 2D Axis System curve formatting

Go back to the 'Curve Properties' dialog, and change the marker to appear every '100' points.   Click on the 'Labels' tab to activate it.   Drag and drop the 'Speed' channel from the Data Portal to the 'Labels' tab channel control labeled 'From channel:'.   Set the 'Alignment:' to 'Automatic'.   Set the 'Repeat text' to 'Every n points', and then set the 'n' option to '100'.   Click the 'OK' button to close the 'Curve Properties' and then again to close the '2D Axis System' dialog.  

NI DIAdem VIEW 2D Axis System curve formatting

NI DIAdem VIEW 2D Axis System curve formatting

NI DIAdem VIEW 2D Axis System curve formatting

Another example of labeling points on a 2D Axis System curve can be found in the tutorial for FFT Full Spectrum.  

Load the '2D Axis System' settings dialog for the 2D Axis System in the VIEW sheet upper left area, and change the color for curve No. 2 to 'Blue'.  

NI DIAdem VIEW 2D Axis System curve formatting

NI DIAdem VIEW 2D Axis System curve formatting

Use the 'Band Zoom' toolbar for the 2D Axis System in the VIEW sheet upper right area to zoom into the X-axis range from 5 to 10 seconds.  

NI DIAdem VIEW 2D Axis System curve formatting

In the Data Portal, select the channel group 'Example', and then right click and choose the option 'Set Default Group'.   Activate the ANALYSIS panel and select the menu options 'Channel Functions', 'Find Peaks'.   Configure the 'Find Peaks' dialog as shown below and then click the 'Calculate' button.   Click the 'Close' button to close the dialog.   Two new channels were created in the channel group 'Example' named 'PeakX', and 'PeakY'.  

NI DIAdem VIEW 2D Axis System curve formatting

Load the '2D Axis System' settings dialog for the 2D Axis System in the VIEW sheet upper left area.   Drag and drop the 'PeakY' channel from the Data Portal to the '2D Axis System' dialog, curve No. 1, 'Y-Channel'.   Drag and drop the 'PeakX' channel from the Data Portal to the '2D Axis System' dialog, curve No. 1, 'X-Channel'.   Change the 'Color' for curve No. 1 to 'No Color'.   Click on the curve No. 2 'Properties' button and configure the 'Markers' as shown below.   Activate the 'Labels' tab and configure it as shown below.   Click the 'OK' button to close the 'Curve Properties' dialog.   In the '2D Axis System' dialog, set the 'Scaling' to 'Manually over all curves' and set the Y-Axis end value to '7000'.   Click the 'OK' button to close the dialog.   The peak values for the 'RPM' channel are now shown and identified with a marker for the first 10 seconds of the channel.  

NI DIAdem VIEW 2D Axis System curve formatting

NI DIAdem VIEW 2D Axis System curve formatting

NI DIAdem VIEW 2D Axis System curve formatting

NI DIAdem VIEW 2D Axis System curve formatting

NI DIAdem VIEW 2D Axis System curve formatting

Modify the display of the 2D Axis System lengend by moving the mouse cursor to the VIEW sheet lower left and hovering the mouse over the divider between the curve and the legend.   Click and hold the left mouse button and drag the divider to the left, exposing the legend.  

Legend Settings

NI DIAdem VIEW 2D Axis System curve formatting

NI DIAdem VIEW 2D Axis System curve formatting

Access the legend settings by right clicking on a 2D Axis System and choosing 'Legend...' from the popup menu.   Remove the display of the 'Unit' by selecting the second row in the 'Properties for display:', and then clicking the '<' button to the left.   Note the list of channel properties in the 'Properties not for display:' that could be added to the legend.   Click the 'OK' button to close the dialog.  

NI DIAdem VIEW 2D Axis System curve formatting

NI DIAdem VIEW 2D Axis System curve formatting

NI DIAdem VIEW 2D Axis System curve formatting

Background Segments

In the tutorial Finding a Channel Event, the curve feature 'Background Segments' was used to highlight sections of the time history when the event search conditions were true.  

NI DIAdem Data Portal

The VBScript code below will replicate the prior manual operations.


' Curve Formatting

Call LogFileDel()

Dim oChnX, oChnY, oChnPeakX, oChnPeakY
Dim oSheet, oAreaTop, oAreaCenter, oAreaBottom, o2DCurve
Dim sPathDocuments, sPathData
sPathDocuments = ProgramDrv & "Examples\Documents\"
sPathData      = ProgramDrv & "Examples\Data\"
Call Data.Root.Clear()
Call DataFileLoadSel(sPathData & "Example_data.tdm", "TDM", "[1]/*", "Load|ChnXYRelation")

'Add a new View sheet and split it into three equal horizontal areas: Top, Center, Bottom
Call View.NewLayout
Set oSheet = View.ActiveSheet
Set oAreaTop = oSheet.ActiveArea
oAreaTop.Name = "Top"
Set oAreaBottom = oAreaTop.SplitBottom("BottomArea",0.33)
Set oAreaCenter = oAreaTop.SplitBottom("CenterArea",-1)

'Plot the channels 'Speed' and 'RPM' to the top area
oAreaTop.DisplayObjType = "CurveChart2D"   
oAreaTop.DisplayObj.YScaling = "n systems [phys.]"    ' "1 system [phys.]"  "n systems [phys.]"  "n axes [phys.]"  
Set oChnX = Data.GetChannel("Example/Time")
Set oChnY = Data.GetChannel("Example/Speed")
Set o2DCurve = oAreaTop.DisplayObj.Curves2D.Add(oChnX.GetReference(eRefTypeIndexName),oChnY.GetReference(eRefTypeIndexName))
'Add markers to the 'Speed' curve
o2DCurve.MarkerType                 = "square"
o2DCurve.MarkerFrequencyMode        = "CalcNPoint"
o2DCurve.MarkerIntervalPoints       = 100
'o2DCurve.MarkerIntervalLength       = 10
o2DCurve.MarkerLineWidth            = "min"
o2DCurve.Type                       = "Line"
o2DCurve.LabelChannelName           = oChnY.GetReference(eReferenceIndexName)
o2DCurve.LabelIndexChannelName      = ""
o2DCurve.LabelChannelOrientation    = "automatic"
o2DCurve.LabelIntervalPoints        = 100
o2DCurve.LabelIntervalLength        = 0
o2DCurve.LabelRepetitionMode        = eVIEWLabelRepetitionNthPoint
Set oChnY = Data.Root.ChannelGroups(1).Channels("RPM")
Set o2DCurve = oAreaTop.DisplayObj.Curves2D.Add(oChnX.GetReference(eRefTypeIndexName),oChnY.GetReference(eRefTypeIndexName))
o2DCurve.Color = "blue"  '"red","green","blue","violet","turquoise","grey","dark red",..

'Plot the channel  'RPM' to the center area
oAreaCenter.DisplayObjType = "CurveChart2D"   
oAreaCenter.DisplayObj.YScaling = "1 system [phys.]"    '' "1 system [phys.]"  "n systems [phys.]"  "n axes [phys.]" 
Set oChnX = Data.GetChannel("Example/Time")
Set oChnY = Data.GetChannel("Example/RPM")
Set o2DCurve = oAreaCenter.DisplayObj.Curves2D.Add(oChnX.GetReference(eRefTypeIndexName),oChnY.GetReference(eRefTypeIndexName))
'Zoom in to the X-axis range 0 to 10 sec
oSheet.Cursor.X1 = 0.0
oSheet.Cursor.X2 = 10.0
oAreaCenter.DisplayObj.XScalingMode = "RangeZoom"
o2DCurve.Color = "blue"  '"red","green","blue","violet","turquoise","grey","dark red",..
'Find the first five maximum peaks for the channel 'RPM'
Call oChnY.ChannelGroup.Activate()
Set oChnPeakX = oChnY.ChannelGroup.Channels.Add(oChnY.Name & "_PeakX",DataTypeChnFloat64)
Set oChnPeakY = oChnY.ChannelGroup.Channels.Add(oChnY.Name & "_PeakY",DataTypeChnFloat64)
Call ChnPeakFind(oChnX, oChnY, oChnPeakX, oChnPeakY, 5, "Max.Peaks", "Time")
'Plot channels oChnPeakX and oChnPeakY
Set o2DCurve = oAreaCenter.DisplayObj.Curves2D.Add(oChnPeakX.GetReference(eRefTypeIndexName),oChnPeakY.GetReference(eRefTypeIndexName))
o2DCurve.Color = ""  '"red","green","blue","violet","turquoise","grey","dark red",..
o2DCurve.MarkerType                 = "square"
o2DCurve.MarkerColorAuto            = false
o2DCurve.MarkerColor                = "red"
o2DCurve.MarkerFillColor            = ""
o2DCurve.MarkerSize                 = 3
o2DCurve.MarkerFrequencyMode        = "CalcNPoint"
o2DCurve.MarkerIntervalPoints       = 1
o2DCurve.MarkerIntervalLength       = 10
o2DCurve.MarkerLineWidth            = "0.5"
o2DCurve.Type                       = "Line"
o2DCurve.LabelChannelName           = oChnPeakY.GetReference(eReferenceIndexName)
o2DCurve.LabelIndexChannelName      = ""
o2DCurve.LabelChannelOrientation    = "automatic"
o2DCurve.LabelMode                  = eVIEWLabelModeChannel
o2DCurve.LabelText                  = ""
o2DCurve.LabelIntervalPoints        = 1
o2DCurve.LabelIntervalLength        = 0
o2DCurve.LabelRepetitionMode        = eVIEWLabelRepetitionEveryPoint
o2DCurve.LabelColorAuto             = false
o2DCurve.LabelColor                 = "red"
o2DCurve.LabelColorRGB              = 0
oAreaCenter.DisplayObj.YScalingMode = "manual"
oAreaCenter.DisplayObj.YScalingBegin       = 800.650000000373
oAreaCenter.DisplayObj.YScalingEnd         = 6023.20866569877

'Plot the channel  'RPM' to the center area
oAreaBottom.DisplayObjType = "CurveChart2D"   
oAreaBottom.DisplayObj.YScaling = "1 system [phys.]"    '' "1 system [phys.]"  "n systems [phys.]"  "n axes [phys.]" 
Set oChnX = Data.GetChannel("Example/Time")
Set oChnY = Data.GetChannel("Example/RPM")
Set o2DCurve = oAreaBottom.DisplayObj.Curves2D.Add(oChnX.GetReference(eRefTypeIndexName),oChnY.GetReference(eRefTypeIndexName))
'Configure the legend for the bottom area
oAreaBottom.DisplayObj.LegendItems.Remove(2)
oAreaBottom.DisplayObj.LegendWidth = 120

Call WndShow("VIEW")


Flags

Flags may be used to visually mark points or sections of a curve, and then to copy, delete, and interpolate curve sections.   In the image below, you can see peaks and valleys flagged, as well as a continuous section of a curve.   The 2D Axis System Flags toolbar is highlighted in the upper right of the image of the VIEW panel shown below.  

NI DIAdem VIEW flags toolbar

Load the file 'Example.tdm' in order to follow this tutorial.

Before using flags, it is important to configure the DIAdem settings for the VIEW panel flags.   From any panel, select the menu options 'Settings', 'DIAdem Settings...', select the 'Panels' section, and then under 'Flag settings' review the options.   It is recommended to set 'Remove selected points:' to 'Set values to NoValue'.   The choice of 'Linear' or 'Spline' for the option 'Interpolate selected points:' is an engineering choice dependent upon each situation (this tutorial will use the 'Linear' option).  

DIAdem VIEW global settings for flags

The DIAdem VIEW panel toolbar has the following flag buttons:

NI DIAdem VIEW flags toolbar 'Remove Flags from All Data'   Remove Flags from All Data   Removes all flags from every channel (and 2D axis curve) in the Data Portal.  

DIAdem v2018 and later has the following flag options accessible from the VIEW panel 2D Axis System toolbar:

NI DIAdem VIEW flags toolbar 'Set Flags'   Set Flags   Use the 'Crosshair Cursor' with this toolbar to specify individual curve points to be flagged.   Use the 'Band Cursor' with this toolbar to specify a curve section to be flagged.  

NI DIAdem VIEW flags toolbar 'Remove Flags'   Remove Flags   Removes the flag at the point specified by the 'Crosshair Cursor', or those at and between the 'Band Cursor'.  

NI DIAdem VIEW flags toolbar 'Copy Delete Interpolate'   
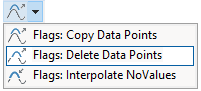
Copy, Delete, Interpolate   These three functions operate on flags set on a curve in the currently active 2D axis system.   The 'Delete' and the 'Interpolate' functions depend on the DIAdem settings.  

NI DIAdem VIEW flags toolbar 'Set Data Point and Flag'   Set Data Point and Flag   Use this toolbar to specify a new point value to be included in an interpolation.   Using the 'Crosshair Cursor', identify on a 2D Axis System curve the Y-axis position to assign to an existing point previously set to NoValue.   The interpolation employed will be either 'Linear' or 'Spline', depending on the DIAdem settings.  

Set Flags

Use the 'Crosshair Cursor' specify a curve point to be flagged, and then click the 'Set Flags' toolbar button.   A large red dot will appear on the 2D axis curve to confirm that the flag has been set.  

Use the 'Band Cursor' specify a series of sequential curve points to be flagged, and then click the 'Set Flags' toolbar button.   Large red dots will appear on the 2D axis curve for each point selected to confirm that the flag has been set.  

NI DIAdem VIEW flags toolbar

Remove Flags

Use the 'Crosshair Cursor' specify a flag to remove, and then click the 'Remove Flags' toolbar button.   The large red dot on the curve representing the flag will be removed.  

Use the 'Band Cursor' to specify a range of flags along a curve to be removed, and then click the 'Remove Flags' toolbar button.   The large red dots on the curve representing the flags will be removed.  

Note that The DIAdem VIEW panel toolbar button 'Remove Flags from All Data' is also available.   This function removes all flags from every channel (and 2D axis curve) in the Data Portal.  

Delete Data Points

The action perfomed when clicking this toolbar option is dependent upon the DIAdem global VIEW panel settings for flags 'Remove selected points:'.  

'Set values to NoValue'   will set all points flagged in the active 2D axis system to NoValue.   This is the recommended action because it allows those NoValues to be interpolated linearly or as a spline between the neighboring points (that are not NoValue).   The large red dots representating the flags will disappear, the curve will disappear at that particular point, but the flag at those data point(s) will still exist.   Note that NoValues in a channel may limit what subsequent channel manipulations and analysis may be performed on that channel.  

'Delete values'   will delete all points flagged in the active 2D axis system.   This will change the number of values in the channel (size/length), possibly limiting what channel analysis and minipulations can be done with that channel with any related channels.   It may also require that a Time or Date/Time channel needs to be reconstructed.   The large red dots representating the flags will disappear (because the points have been deleted).  

Interpolate Points

This toolbar button will only be enabled when at least one flag is present in the active 2D axis curve.   Interpolation will only occur where flags are present at points with the value NoValue.   Interpolation will be performed on either side of the point(s) with NoValue, at the position of the closest point that is not NoValue.  

The type of interpolation performed (linear or spline) is dependent upon the DIAdem settings for 'Interpolate selected points:', with options of 'Linear' or 'Spline'.   The exception to this is if the flag toolbar function 'Set Data Point and Flag' is employed, then any new point values specified for former NoValues will be included in the interpolation.  

The behaviour and use of the 'Interpolate Points' button will be illustrated with the following example.   The curve section below is plotted in REPORT with the individual points highlighted with square hollow markers.  

NI DIAdem VIEW flags toolbar

In the VIEW panel 2D axis system shown below, four points have been flagged.   Two of those points on the right of the curve are sequential, causing the curve to be highlighted with a thick red line between the two flags.  

NI DIAdem VIEW flags toolbar

With the DIAdem global VIEW panel settings for flags set to 'Set values to NoValue', clicking on the flag toolbar button 'Delete Data Points' will cause those four points to be set to NoValue.   As a result, the curve appears disconnected as shown below.   Note however, the flags at each of those points set to NoValue continue to exist.  

NI DIAdem VIEW flags toolbar

An additional pair of points that are not set as NoValue are flagged as shown below.  

NI DIAdem VIEW flags toolbar

Clicking the 2D axis system toolbar flag button 'Interpolate Points' will cause the four points with flags and values of NoValue to be interpolated with the neighboring points with values.   The two flags on points that are not set to NoValue are ignored (not interpolated).  

NI DIAdem VIEW flags toolbar

An additional tutoral exists for using flags to 'Remove Spikes/Outliers' from a signal.   In that tutorial, a flag was set at the spike location, and then the value (channel row) was set to NoValue.   Then the flag option 'Flags: Interpolate NoValues' was used to calculate an interpolated value on either side of that NoValue.  

Set Data Point and Flag

Using the same curve portion from the 'Example/RPM' channel, and clearing all flags, three points on the curve are flagged as shown in the second image below as a highlighted three point curve.  

NI DIAdem VIEW flags toolbar  

NI DIAdem VIEW flags toolbar

The flag toolbar button 'Delete values' is then clicked, setting those three points to NoValue.  

NI DIAdem VIEW flags toolbar

The 'Free Cursor' is used to specify a new y-axis value for the third point currently assigned NoValue.   Next, the toolbar button 'Set Data Point and Flag' is clicked to assign a new value to the point.   This causes the new point value to appear connected to the last value to the right of it that has a value.  

NI DIAdem VIEW flags toolbar

Clicking on the flag toolbar 'Interpolate Points' causes interpolation of the flagged points with a value of NoValue, and the point flagged with 'Set Data Point and Flag' to be included in that interpolation.  

NI DIAdem VIEW flags toolbar

The original curve and points are shown below for comparison.   The inclusion of the point assigned a new value using the 'Set Data Point and Flag' toolbar option is evident.   Although only one new point value was set with 'Set Data Point and Flag', multiple points with a value of NoValue could have been assigned a new (Y) value, and then included in the interpolation.  

NI DIAdem VIEW flags toolbar  

Copy Data Points

The same curve portion from the 'Example/RPM' channel is shown in the REPORT plot below, with the actual points highlighted with hollow square red markers.  

NI DIAdem VIEW flags toolbar  

The 'Band Cursor' is used to select a range of points on the curve.   Then the flag toolbar 'Set Flags' is clicked to flag all of the points within the band cursor.  

NI DIAdem VIEW flags toolbar - Copy Data Points  

Click on the flag toolbar button 'Copy Data Points'.   The flagged curve is copied, and two new channels are created, one for the X values, and one for the Y values.  

NI DIAdem VIEW flags toolbar - Copy Data Points  

A new VIEW sheet area is added below the existing, and then the new channels with the copied data points in dragged and dropped into the new VIEW sheet area, and a 2D axis system is chose.  

NI DIAdem VIEW flags toolbar - Copy Data Points  


What You Learned
  • The VIEW panel flags toolbar options allow you to interactively and visually flag points on a 2D axis system.  
  • The points flagged can be set to NoValue, and then assigned a new Y-axis value, and/or interpolated between neighboring values using a linear or spline fit.  
  • Points flagged can be deleted from a channel.  
  • Flagged points can be copied to a new pair of X & Y channels.  


Map

The DIAdem VIEW area supports a display type of Map and the capability to overlay GPS coodinate data on the map.   The two types of maps supported by DIAdem are OpenStreetMap, and a user-defined map server.   OpenStreetMap data is free of licensing costs and you can use, edit, and customize the data according to your needs.   The map display in DIAdem VIEW uses the Standard World Geodetic System 1984 (WGS 84) as a reference system in cartography.   DIAdem has an extensive set of map data visualization tools that are best described through an example.   The DIAdem map examples can be found in the DIAdem help system under the titles of: 'Bird's Eye View Display', 'Map Display in DIAdem View', and 'Synchronizing Maps, Videos, and Measurement Data'.  

NI DIAdem VIEW map

The tutorial that follows will build the map as shown above in the VIEW panel.   Activate the NAVIGATOR panel and then clear the Data Portal with the menu options 'File', 'New'.   Use the NAVIGATOR menu commands 'File', 'Open' to load the data file 'Austin_drive.tdm' from the folder: 'C:\Program Files\National Instruments\DIAdem ####\Examples\Data\'.   Activate the VIEW panel and clear it by using the menu commands 'File', 'New'.   Choose the 'Regular Worksheet Partitions' group bar and then the option 'Two Areas'.  

ANALYSIS - FFT (One Time Signal) power spectral density (PSD)

Right click in the VIEW sheet upper area and select the option 'Display Type', 'Map' from the popup menu that appears.   Right click on the map and choose the 'Settings...' menu.   Configure the 'Map' dialog exactly as shown in the image below.   This will require you to drag and drop channels from the Data Portal to the 'Map' dialog table at the bottom.  

NI DIAdem VIEW map

Click on the VIEW toolbar 'Cursor Parameters'.   Configure the 'Cursor Parameters' dialog as shown in the images below.   Most of the defaults should be fine, just make sure to assign a play speed of 15 to the 'Play' tab.  

NI DIAdem VIEW map

NI DIAdem VIEW map

NI DIAdem VIEW map

NI DIAdem VIEW map

NI DIAdem VIEW map

Activate the VIEW toolbar 'Crosshair Cursor', and the 'Free Cursor' so that the play speed set in the 'Cursor Parameters' dialog works properly.   Click the 'Play' button in the toolbar to confirm the map is configured properly.   Click the 'Pause' button to pause the play.  

NI DIAdem VIEW map

Configure the VIEW sheet lower area with a 2D Axis System.   Select the channel 'TimeStamp', and then while holding the CTRL key, select the channels 'Satellites' and 'Elevation'.   Drag and drop them into the VIEW sheet lower area and choose the option '2D Axis System'.   Change the 2D Axis System 'Y-Axis' toolbar option to 'n Systems [linear]'.   Drag the 'Free Cursor' in the VIEW sheet lower area 2D Axis System from left to right and confirm that the marker in the upper area on the map moves in response.   Click the VIEW toolbar 'Play' button.  

NI DIAdem VIEW map

The VBScript code below will replicate the prior manual operatons.  


' Map

'Note:  At around 40 seconds, the track on the map is off of the road.
'       This happens just prior to the drop in the # of satellites, and
'       the loss in the number of satellites is likely the root cause. 

Call LogFileDel()

Dim oChnTime, oChnLat, oChnLon, oChnSatellites, oChnElevation
Dim oSheet, oAreaTop, oAreaCenter, oAreaBottom, o2DCurve, oMap, oCursor
Dim sPathDocuments, sPathData
sPathDocuments = ProgramDrv & "Examples\Documents\"
sPathData      = ProgramDrv & "Examples\Data\"

Call Data.Root.Clear()
Call DataFileLoadSel(sPathData & "Austin_drive.tdm", "TDM", "[1]/[1,2,3,7,8]", "Load|ChnXYRelation")
Set oChnTime = Data.GetChannel("GPS Tracks/TimeStamp")
Set oChnLon = Data.GetChannel("GPS Tracks/Longitude")
Set oChnLat = Data.GetChannel("GPS Tracks/Latitude")
Set oChnSatellites = Data.GetChannel("GPS Tracks/Satellites")
Set oChnElevation = Data.GetChannel("GPS Tracks/Elevation")

'Add a new View sheet and split it into three equal horizontal areas: Top, Center, Bottom
Call View.NewLayout
Set oSheet = View.ActiveSheet
Set oAreaTop = oSheet.ActiveArea: oAreaTop.Name = "Top"
Set oAreaBottom = oAreaTop.SplitBottom("Bottom",-1)

'Configure the VIEW sheet top area as a Map
oAreaTop.DisplayObjType = "Map"   
'Set the map parameters
Set oMap = oAreaTop.DisplayObj
oMap.MapType = "OSM Mapnik"
oMap.ZoomLevel = 17
oMap.ShowTrack = True
oMap.MapMovingMode = "Center"
oMap.UseCache = False     'Cache data won't be saved to the folder below unless oMap.UseCache = True
oMap.CachePath = "C:\Users\Public\Documents\National Instruments\DIAdem\MAP Cache\"
'The next three correspond to: "X-Cursor", "Y-Cursor", "Z-Cursor"
oMap.SynchronisationChannelName = oChnTime.GetReference(eReferenceIndexName)
oMap.LongitudeChannelName = oChnLon.GetReference(eReferenceIndexName)
oMap.LatitudeChannelName = oChnLat.GetReference(eReferenceIndexName)
'Set the track color in the map to change with respect to the elevation
oMap.ColorChannelName = oChnElevation.GetReference(eReferenceIndexName)
oMap.SynchronisationDimension = "X-Cursor"
oMap.LongitudeDimension = "Y-Cursor"
oMap.LatitudeDimension = "Z-Cursor"

'Cursor Parameters dialog
Set oCursor = oSheet.Cursor
'.Speed defines how quickly the cursor follows the map
'IMPORTANT: Set the following prior to .Play() in order for the oCursor.Speed argment to be recognized:
'           oSheet.Cursor.Type="Crosshair": oSheet.Cursor.Mode="arbitrary"
oCursor.Speed = 15
oCursor.X1 = oChnTime.Minimum
oCursor.X2 = oChnTime.Maximum
''These don't apply for a Map:  .XRangeMode, .StartPos, .EndPos

oAreaBottom.DisplayObjType = "CurveChart2D"   
oAreaBottom.DisplayObj.YScaling = "n systems [phys.]"    ' "1 system [phys.]"  "n systems [phys.]"  "n axes [phys.]"  
Set o2DCurve = oAreaBottom.DisplayObj.Curves2D.Add(oChnTime.GetReference(eRefTypeIndexName),oChnElevation.GetReference(eRefTypeIndexName))
Set o2DCurve = oAreaBottom.DisplayObj.Curves2D.Add(oChnTime.GetReference(eRefTypeIndexName),oChnSatellites.GetReference(eRefTypeIndexName))

'IMPORTANT:  Set cursor as shown below in order for oCursor.Speed = 15 to work properly.
oSheet.Cursor.Type="Crosshair": oSheet.Cursor.Mode="arbitrary"
Call View.Refresh()
Call WndShow("VIEW")
Call View.ActiveSheet.Cursor.Play(True)


Video

The VIEW panel supports embedding a video into a VIEW sheet area.   The types of video files supported are MPEG, MPG, WMV, and AVI format.   Using the VIEW toolbar, you can play, pause, and repeat play the video.   The 'Position Cursor' dialog also supports the controls for fast forward or fast reverse and step-by-step forward or step-by-step reverse.   Before playing the video, you may use the VIEW menu options to zoom in or out of the video.   The video context menu also allows you to turn the video sound on or off.   The best experience of viewing a video synchronized with measurement data is achieved when the video codec does not use interframe compression.   If you experience a problem playing a video in the DIAdem VIEW panel, see the DIAdem help document topic 'Requirements for Playing Videos in DIAdem VIEW'.  

The greatest value of showing a video in the VIEW panel is when the video is synchronized with a measurement data channel.  

Video In Channel Data

This tutorial will embed a video into a VIEW sheet area along with measurement data that is synchronized to the video.   The video itself has been included in the TDM data file.   Activate the NAVIGATOR panel and then clear the Data Portal with the menu options 'File', 'New'.   Use the NAVIGATOR menu commands 'File', 'Open' to load the data file 'Austin_drive.tdm' from the folder: 'C:\Program Files\National Instruments\DIAdem ####\Examples\Data\'.   Activate the VIEW panel and clear it by using the menu commands 'File', 'New'.   Choose the 'Three Worksheet Partitions' group bar and then the option 'Three Areas' where the top is split into two even areas, and a larger horizontal area is below them.  

NI DIAdem VIEW video

In the VIEW top left area, right click and choose the context menu options 'Display Type', 'Video'.   The 'Video' dialog will appear.   Activate the 'Video' tab in the 'Video' dialog and select the option 'Video channel'.   Drag the 'Austin_Drive' video channel from the Data Portal to the 'Video' dialog channel control to the right of 'Video channel'.   Make sure the checkbox 'Keep aspect ratio' is checked.  

NI DIAdem VIEW video

NI DIAdem VIEW video

Activate the 'Synchronization' tab in the 'Video' dialog.   Click on the 'Cursor Synchronization...' button and set the 'Time axis:' drop down box option to 'X-Cursor'.   Click 'OK' to close the 'Cursor Synchronization' dialog.  

NI DIAdem VIEW video

Activate the 'Object List' tab in the 'Video' dialog and ensure the list box is clear of any items.   Use the 'X' toolbar to delete any that exist.   Close the 'Video' dialog and accept the changes by clicking the 'OK' button.

NI DIAdem VIEW video

Click on the VIEW toolbar 'Cursor Parameters'.   Configure the 'Cursor Parameters' dialog as shown in the images below.   Most of the defaults should be fine, just make sure to assign a play speed of 5 to the 'Play' tab.  

NI DIAdem VIEW map

NI DIAdem VIEW video

In the Data Portal, select the channel 'Time Since Engine Start', and then the channels 'Engine RPM', 'Speed', and 'Engine Load'.   Drag and drop the channels into the VIEW sheet lower area and select the option '2D Axis System' when the context popup menu appears.   Set the 2D Axis System toolbar option 'Y-Axis' to 'n Systems[linear]'.   Right click in the '2D Axis System' area and choose the context menu option 'Settings...'.   Click on the 'Cursor Synchronization...' button and insure the 'Abscissa:' option is set to 'X-Cursor', and the 'Ordinate:' option is set to 'Y-Cursor'.   Click the 'OK' button twice to close the dialogs and confirm the settings.  

NI DIAdem VIEW video

NI DIAdem VIEW video

Click the mouse in the center of the VIEW sheet lower area with the 2D Axis System.   With the left mouse button held down, drag the cursor left and right and observe how the video changes because it is synchronized with the data channels via the channel 'Time Since Engine Start'.   This synchronization exists because the video Cursor Synchronization is set to 'X-Cursor', and the 2D Axis System Cursor Synchronization for the 'Abscissa:' is set to 'X-Cursor'.  

NI DIAdem VIEW video

NI DIAdem VIEW video

The VBScript code below will replicate the prior manual commands.  


' Video

Call LogFileDel()

Dim oChnX, oChnY, oChnVideo
Dim oSheet, oAreaTopLeft, oAreaTopRight, oAreaBottom, oVideo, o2DCurve, oCursor
Dim sPathDocuments, sPathData
sPathDocuments = ProgramDrv & "Examples\Documents\"
sPathData      = ProgramDrv & "Examples\Data\"
Call Data.Root.Clear()
Call DataFileLoadSel(sPathData & "Austin_drive.tdm", "TDM", "[2]/*|[3]/*", "Load|ChnXYRelation")
Set oChnVideo = Data.GetChannel("Video_data/Austin_Drive")

'Add a new View sheet and split it into three areas: TopLeft, TopRight, Bottom
Call View.NewLayout
Set oSheet = View.ActiveSheet
Set oAreaTopLeft = oSheet.ActiveArea: oAreaTopLeft.Name = "TopLeft"
Set oAreaBottom = oAreaTopLeft.SplitBottom("Bottom",-1)
Set oAreaTopRight = oAreaTopLeft.SplitRight("TopRight",-1)
Call WndShow("VIEW")

'Configure the VIEW sheet top left area as a Video
oAreaTopLeft.DisplayObjType = "Video"   
'Set the video parameters
Set oVideo = oAreaTopLeft.DisplayObj
'Below first argument options are eVideoFile and eVideoChannel 
Call oVideo.SetVideo(eVideoChannel, oChnVideo.GetReference(eReferenceIndexName))
oVideo.KeepRatio = True
oVideo.CursorReference = "X-Cursor"
oVideo.StartTime = 0.0    ' seconds
oVideo.Transparency = 50
oVideo.Sound = False
'.ZoomCursor changes the zoom function for a video
oVideo.ZoomCursor = "StandardCursor"    '"StandardCursor","MoveZoomCursor","FrameZoomCursor"
Call LogFileWrite("oVideo.FrameRate : " & Str(oVideo.FrameRate,"AutoAdj") & " [1/s]")
Call oVideo.OverlayObjects.RemoveAll()

'Cursor Parameters dialog
Set oCursor = oSheet.Cursor
'.Speed defines how quickly the cursor follows the map
'IMPORTANT: Set the following prior to .Play() in order for the oCursor.Speed argment to be recognized:
'           oSheet.Cursor.Type="Crosshair": oSheet.Cursor.Mode="arbitrary"
oCursor.Speed = 5
oCursor.X1 = 0
oCursor.X2 = 1
oCursor.XRangeMode = "automatic"
oCursor.Interpolating=true
oCursor.ConstantDeltas=1
oCursor.Dimensions(1).Name        = "X-Cursor"
oCursor.Dimensions(1).Description = "Engine RPM, Speed, Engine Load"

'Configure the VIEW sheet bottom area
oAreaBottom.DisplayObjType = "CurveChart2D"   
oAreaBottom.DisplayObj.YScaling = "n systems [phys.]"    ' "1 system [phys.]"  "n systems [phys.]"  "n axes [phys.]"  
Set oChnX = Data.GetChannel("OBD data/Time Since Engine Start")
Set oChnY = Data.GetChannel("OBD data/Engine RPM")
Set o2DCurve = oAreaBottom.DisplayObj.Curves2D.Add(oChnX.GetReference(eRefTypeIndexName),oChnY.GetReference(eRefTypeIndexName))
Set oChnY = Data.GetChannel("OBD data/Speed")
Set o2DCurve = oAreaBottom.DisplayObj.Curves2D.Add(oChnX.GetReference(eRefTypeIndexName),oChnY.GetReference(eRefTypeIndexName))
Set oChnY = Data.GetChannel("OBD data/Engine Load")
Set o2DCurve = oAreaBottom.DisplayObj.Curves2D.Add(oChnX.GetReference(eRefTypeIndexName),oChnY.GetReference(eRefTypeIndexName))
oSheet.Cursor.X1 = 0.0
oSheet.Cursor.Type="Crosshair"
oSheet.Cursor.Mode="GraphPoints"

Call View.Refresh()
Call View.ActiveSheet.Cursor.Play(True)

The script above can be modified to reference an external video file by making the changes shown below:


'Configure the VIEW sheet top left area as a Video
oAreaTopLeft.DisplayObjType = "Video"   
'Set the video parameters
Set oVideo = oAreaTopLeft.DisplayObj
sFilePathVideo = sPathDocuments & "Austin_Drive.wmv"
'Below first argument options are eVideoFile and eVideoChannel 
Call oVideo.SetVideo(eVideoFile, sFilePathVideo)
oVideo.KeepRatio = True

Video From External File

This tutorial demonstrates embedding an external video file into a VIEW sheet area configured for video.   Activate the NAVIGATOR panel and then clear the Data Portal with the menu options 'File', 'New'.   Use the NAVIGATOR menu commands 'File', 'Open' to load the data file 'Austin_drive.tdm' from the folder: 'C:\Program Files\National Instruments\DIAdem ####\Examples\Data\'.   Activate the VIEW panel and clear it by using the menu commands 'File', 'New'.   Choose the 'Three Worksheet Partitions' group bar and then the option 'Three Areas' where the top is split into two even areas, and a larger horizontal area is below them.  

NI DIAdem VIEW video

In the VIEW top left area, right click and choose the context menu options 'Display Type', 'Video'.   The 'Video' dialog will appear.   Activate the 'Video' tab in the 'Video' dialog and select the option 'Video file'.   Click on the '...' button to the very right of the 'Video file' label and then locate the video file 'Birds_Eye_View.mp4' in the folder: 'C:\Program Files\National Instruments\DIAdem ####\Examples\Documents\'.   Make sure the checkbox 'Keep aspect ratio' is checked.  

NI DIAdem VIEW video

NI DIAdem VIEW video

Activate the 'Synchronization' tab in the 'Video' dialog.   Click on the 'Cursor Synchronization...' button and set the 'Time axis:' drop down box option to 'X-Cursor'.   Note the 'Frame rate:' and 'Duration:' values.   Write them down, you will need them later.   Click 'OK' to close the 'Cursor Synchronization' dialog.  

NI DIAdem VIEW video

Activate the 'Object List' tab in the 'Video' dialog and ensure the list box is clear of any items.   Use the 'X' toolbar to delete any that exist.   Close the 'Video' dialog and accept the changes by clicking the 'OK' button.

NI DIAdem VIEW video

Click on the VIEW toolbar 'Cursor Parameters'.   Configure the 'Cursor Parameters' dialog as shown in the images below.   Most of the defaults should be fine, just make sure to assign a play speed of 5 to the 'Play' tab.  

NI DIAdem VIEW map

NI DIAdem VIEW video

In the Data Portal, expand the channel group 'OBD data', and then right click on it and select the menu option 'Set Default Group'. Click on the channel 'Time Since Engine Start' and review the Base Properties at the bottom of the Data Portal.   The duration for the channel is 126 seconds.   We are going to build a new time channel to be used for video synchronization that is compatable with the video that has a duration of 8 seconds.  

NI DIAdem VIEW video

Activate the ANALYSIS panel and choose the menu options 'Channel Functions', 'Generate Numeric Channel...'.   In the 'Generate Numeric Channel' dialog, set the 'Channel generation mode' to 'Equidistant'.   Set the 'Start value:' to '0'.   Set the 'End value:' to '8', equal to the video duration value of 8 seconds.   In the Data Portal, click on the channel 'Time Since Engine Start' and get the 'Length' of the channel (1372).   In the 'Generate Numeric Channel', set the 'Number of values' to 1372.   Make sure the checkbox 'Generate implicit channel' is unchecked.   Set the 'Unit:' to 's' for seconds.   Click the 'Calculate' button to generate the channel.   Click the 'Close' button to close the dialog.  

NI DIAdem VIEW video

In the Data Portal, select the channel 'LinearGenerated', right click on it, and choose 'Rename'.   Change the name from 'LinearGenerated' to 'Time_4video'.   Drag the channel 'Time_4video to the second channel position.  

NI DIAdem VIEW video

Activate the VIEW panel.   In the Data Portal, select the 'Time_4video' channel, then with the left mouse pressed down, select the channels 'Engine RPM', 'Speed', and 'Engine Load'.   Drag and drop those channels into the VIEW sheet lower area and select the option '2D Axis System' from the context menu that appears.   Click on the 2D Axis System toolbar 'Y-Axis' and choose the option 'n System [linear]'.  

NI DIAdem VIEW video

Click the mouse in the center of the VIEW sheet lower area with the 2D Axis System.   With the left mouse button held down, drag the cursor left and right and observe how the video changes because it is synchronized with the data channels via the channel 'Time_4video'.   This synchronization exists because the video Cursor Synchronization is set to 'X-Cursor', and the 2D Axis System Cursor Synchronization for the 'Abscissa:' is set to 'X-Cursor'.  

The VBScript code below will replicate the prior manual commands.  


' Video - external video file

' Demonstrates configuring a VIEW sheet area for Video where the video is an external file.
' Note that this example picks channel data that is completely unrelated to the video and
' configures it so that the video is synchronized to the video.
' This is intended to illustrate how to configure channel data that may not have a perfect
' time channel so that it can be used with the video that was simultaneously recorded with
' the channel data.  If the video and channel data is out of sync, then the data channels
' will require additional manipulation, such as adding NoValues to the beginning Y channels
' and then rebuilding the X data channel for video synchronization.

Call LogFileDel()

Dim oChnX, oChnY, sFilePathVideo, oChnVideoX, dVideoDurationSec
Dim oSheet, oAreaTopLeft, oAreaTopRight, oAreaBottom, oVideo, o2DCurve, oCursor
Dim oGrp, oElementList
Dim sPathDocuments, sPathData
sPathDocuments = ProgramDrv & "Examples\Documents\"
sPathData      = ProgramDrv & "Examples\Data\"
Call Data.Root.Clear()
Call DataFileLoadSel(sPathData & "Austin_drive.tdm", "TDM", "[2]/*", "Load|ChnXYRelation")

'Add a new View sheet and split it into three areas: TopLeft, TopRight, Bottom
Call View.NewLayout
Set oSheet = View.ActiveSheet
Set oAreaTopLeft = oSheet.ActiveArea: oAreaTopLeft.Name = "TopLeft"
Set oAreaBottom = oAreaTopLeft.SplitBottom("Bottom",-1)
Set oAreaTopRight = oAreaTopLeft.SplitRight("TopRight",-1)

'Configure the VIEW sheet top left area as a Video
oAreaTopLeft.DisplayObjType = "Video"   
'Set the video parameters
Set oVideo = oAreaTopLeft.DisplayObj
' Birds_Eye_View.mp4:  960x540  10 fps    
sFilePathVideo = sPathDocuments & "Birds_Eye_View.mp4"
Call LogFileWrite("Video file: " & sFilePathVideo)
'Below first argument options are eVideoFile and eVideoChannel 
Call oVideo.SetVideo(eVideoFile, sFilePathVideo)
oVideo.KeepRatio = True
oVideo.CursorReference = "X-Cursor"
oVideo.StartTime = 0.0    ' seconds
oVideo.Transparency = 50
oVideo.Sound = False
'.ZoomCursor changes the zoom function for a video
oVideo.ZoomCursor = "StandardCursor"    '"StandardCursor","MoveZoomCursor","FrameZoomCursor"
Call LogFileWrite("oVideo.FrameRate : " & Str(oVideo.FrameRate,"AutoAdj") & " [1/s]")
'oVideo.FrameRate : 10 [1/s] or frames/sec
Call LogFileWrite("oVideo.NoOfFrames : " & Str(oVideo.NoOfFrames,"AutoAdj"))
'oVideo.NoOfFrames : 79
dVideoDurationSec = oVideo.NoOfFrames/oVideo.FrameRate
Call LogFileWrite("Video duration : " & Str(dVideoDurationSec,"AutoAdj") & " s")
'Video duration : 7.9 s
Call oVideo.OverlayObjects.RemoveAll()

'Cursor Parameters dialog
Set oCursor = oSheet.Cursor
'.Speed defines how quickly the cursor follows the map
'IMPORTANT: Set the following prior to .Play() in order for the oCursor.Speed argment to be recognized:
'           oSheet.Cursor.Type="Crosshair": oSheet.Cursor.Mode="arbitrary"
oCursor.Speed = 1     'Adjust this value to change the playback speed
oCursor.X1 = 0
oCursor.X2 = 1
oCursor.XRangeMode = "automatic"
oCursor.Interpolating=true
oCursor.ConstantDeltas=1
oCursor.Dimensions(1).Name        = "X-Cursor"

'Generate a time channel for the channels in the channel group 'OBD data' that
'will allow those channels to be used for synchronization with the video.
'The key parameter for the video synchronization is a time channel with the same duration
'as the video.
Set oChnX = Data.GetChannel("OBD data/Time Since Engine Start")
Call ChnLinGenImp("Time_4video", oChnX.Size, 0, 1/(oChnX.Size/dVideoDurationSec), "s")
Set oChnVideoX  = Data.GetChannel("Time_4video")
Call ChnValExpand(oChnVideoX)
Call Data.Move(oChnVideoX, oChnX.ChannelGroup, 2)

'Configure the VIEW sheet bottom area
oAreaBottom.DisplayObjType = "CurveChart2D"   
oAreaBottom.DisplayObj.YScaling = "n systems [phys.]"    ' "1 system [phys.]"  "n systems [phys.]"  "n axes [phys.]"  
Set oChnY = Data.GetChannel("OBD data/Engine RPM")
Set o2DCurve = oAreaBottom.DisplayObj.Curves2D.Add(oChnVideoX.GetReference(eRefTypeIndexName),oChnY.GetReference(eRefTypeIndexName))
Set oChnY = Data.GetChannel("OBD data/Speed")
Set o2DCurve = oAreaBottom.DisplayObj.Curves2D.Add(oChnVideoX.GetReference(eRefTypeIndexName),oChnY.GetReference(eRefTypeIndexName))
Set oChnY = Data.GetChannel("OBD data/Engine Load")
Set o2DCurve = oAreaBottom.DisplayObj.Curves2D.Add(oChnVideoX.GetReference(eRefTypeIndexName),oChnY.GetReference(eRefTypeIndexName))
oSheet.Cursor.X1 = 0.0
oSheet.Cursor.Type="Crosshair"
oSheet.Cursor.Mode="GraphPoints"

Call View.Refresh()
Call View.ActiveSheet.Cursor.Play(True)


Textbox

You can add formatted text to a VIEW panel sheet area by configuring it as a 'Textbox'.   The 'Textbox' supports scrolling, word wrapping, alignment, font size, font color, and background color formatting.  

Activate the VIEW panel and clear it by using the menu commands 'File', 'New'.   Choose the 'Three Worksheet Partitions' group bar and then the option 'Three Areas' where the bottom is split into two even areas, and a larger horizontal area is above them.  

NI DIAdem VIEW Textbox

Click in the center of the VIEW sheet lower left area, right click and choose the option 'Display Type', 'Textbox'.  

NI DIAdem VIEW Textbox

In the upper left of the Textbox, click on the 'Settings' toolbar (gear icon).   Configure the 'Textbox' dialog settings as shown below.   Within the 'Text:' input field, enter the text as shown in the VIEW sheet area.  

NI DIAdem VIEW Textbox

NI DIAdem VIEW Textbox

In order to change the 'Background color:', click on the dropdown box, then choose 'Other Colors...' at the bottom and the 'Color' dialog will appear.   At the bottom right, assign '4' to 'Red', '65 to 'Green', and '35' to Blue.   Click the 'OK' button to close all of the open dialogs.  

NI DIAdem VIEW Textbox

Pro Tip: When the settings toolbar (gear icon) isn't shown, double click on the area to edit / copy the contents.

The script below will replicate the prior manual commands.


' VIEW textbox

'Add a new View sheet and split it into three areas: Top, LeftBottom, RightBottom
Dim oSheet, oAreaTop, oAreaLeftBottom, oAreaBottomRight, oTextbox, oGraphic
Call View.NewLayout
Set oSheet = View.ActiveSheet
Set oAreaTop = oSheet.ActiveArea: oAreaTop.Name = "Top"
Set oAreaLeftBottom = oAreaTop.SplitBottom("BottomLeft",-1)
Set oAreaBottomRight = oAreaLeftBottom.SplitRight("BottomRight",-1)

oAreaLeftBottom.DisplayObjType = "Textbox"
Set oTextbox = oAreaLeftBottom.DisplayObj
'Add text to the Textbox
oTextbox.Text = "Date/Time: @@CurrDate@@ @@CurrTime@@" & vbCrLf & vbCrLf
oTextbox.Text = oTextbox.Text & "NI DIAdem VIEW sheet area Textbox." & vbCrLf & vbCrLf
oTextbox.Text = oTextbox.Text & "The Textbox supports a wide range of formatting, including wordrap, scrolling, word wrapping, alignment, font size, font color, and background color formatting.." & vbCrLf  & vbCrLf
oTextbox.Text = oTextbox.Text & "The background color shown here is RGB(4,65,35)" & vbCrLf & vbCrLf
oTextbox.Text = oTextbox.Text & "Use the Textbox to add valuable information about the contents of the other VIEW sheet areas." & vbCrLf & vbCrLf
oTextbox.Text = oTextbox.Text & "" & vbCrLf & vbCrLf
'Format the text
oTextbox.Color = "white"
oTextbox.BkColor ="other colors"
oTextbox.BkColorRGB = RGB(4,65,35)  '16448250
oTextbox.ShowScrollBars = "None"
oTextbox.WordWrap = true
oTextbox.Alignment = "Left"
oTextbox.Font.Size = 14
oTextbox.Font.Bold = False
oTextbox.Font.Italic = False
'Set .ToolbarVisible = False to hide the gear toolbar icon
oTextbox.ToolbarVisible = False
Call oTextbox.Refresh()
''The command below will load the 'Textbox' dialog, BUT it will NOT have the prior settings.
'Call oTextbox.ShowTextPropertiesDlg()

'Configure the right bottom VIEW sheet area as 'Graphic
oAreaBottomRight.DisplayObjType = "Picture"
Set oGraphic = oAreaBottomRight.DisplayObj
'oGraphic.FileName = ProgramDrv & "Examples\Documents\facilit3.png"
'oGraphic.FileName = ProgramDrv & "Examples\Documents\Safetytest_a.JPG"
oGraphic.FileName = ProgramDrv & "Examples\Documents\RotatingShaftAnalysis.gif"
oGraphic.KeepRatio = True
oGraphic.ToolbarVisible = False
''The command below will open the picture settings dialog. 
'Call oGraphic.ShowPictureDlg()

Call View.Refresh()
Call WndShow("VIEW")


DIAdem Example Files

These tutorials are based on the content within the DIAdem sample file 'Example.tdm' that comes with your DIAdem installation.   Clear the Data Portal contents by choosing the NAVIGATOR panel menu 'File', 'New' (or keys CTRL-N).   Load the file 'Example.tdm' into the Data Portal (memory) by choosing the NAVIGATOR panel menu 'File', 'Open...' (or keys CTRL-O) and then browsing for the file in the folder: 'C:\PROGRAM FILES\NATIONAL INSTRUMENTS\DIADEM ####\Libr\Data\' where '####' is the DIAdem version you have installed.  

Other DIAdem Examples

Map Display in DIAdem VIEW

This example shows a map display of a motorbike test ride, along with a 2D Axis System plot of the GPS coordinates, and a 2D Axis System plot of the bike speed, and the altitude.   Toward the end of the video, the playback is paused, and then the user moves the cursor along the 2D Axis System plotted 'Altitude' signal, demonstrating how the other synchronized VIEW sheet areas change in response to that action.

Click the play button to play the video, and then click the full screen icon.   Press the 'Esc' key to abort the video full screen view.  

To run the example above in DIAdem, activate the NAVIGATOR panel, clear the Data Portal, and then load the data file 'VIEW_MapDisplay.tdm' from the folder: 'C:\Program Files\National Instruments\DIAdem ####\Examples\Data\'.   Activate the VIEW panel, create a new VIEW layout, and then load the example file 'VIEW_MapDisplay.tdv' from the folder: 'C:\Program Files\National Instruments\DIAdem ####\Examples\Documents\'.  

Bird's Eye View

In this DIAdem example, the vehicle is displayed from above as a static symbol, and the road objects represented as markers approach and move around the static vehicle.   A video is displayed to show the driver's view from the static vehicle.   The position of the vehicle on a OpenStreetMap is displayed.   A sensor signal is displayed and synchronized with the other VIEW sheet areas.  

Click the play button to play the video, and then click the full screen icon.   Press the 'Esc' key to abort the video full screen view.  

To run the example above in DIAdem, activate the NAVIGATOR panel, clear the Data Portal, and then load the data file 'Birds_Eye_View.tdm' from the folder: 'C:\Program Files\National Instruments\DIAdem ####\Examples\Data\'.   Activate the VIEW panel, create a new VIEW layout, and then load the example file 'Birds_Eye_View.tdv' from the folder: 'C:\Program Files\National Instruments\DIAdem ####\Examples\Documents\'.  

Synchronizing Maps, Videos, and Measurement Data

This example shows data recorded from the vehicle CAN bus, along with simultaneously recorded video, and GPS data.   All of these different types of data are shown in a single VIEW sheet, using the different area types available in DIAdem.   Synchronization was accomplished by using the numeric time channel for the time series data, and the latitude and longitude channel data.  

Click the play button to play the video, and then click the full screen icon.   Press the 'Esc' key to abort the video full screen view.  

To run the example above in DIAdem, activate the NAVIGATOR panel, clear the Data Portal, and then load the data file 'Austin_Drive.tdm' from the folder: 'C:\Program Files\National Instruments\DIAdem ####\Examples\Data\'.   Activate the VIEW panel, create a new VIEW layout, and then load the example file 'Austin_Drive.tdv' from the folder: 'C:\Program Files\National Instruments\DIAdem ####\Examples\Documents\'.  


Copyright © 2021,2022 Mechatronic Solutions LLC, All Rights Reserved