Time Series Data Management System   (TSDMS)

TSDMS Solutions Blog Pricing About Support


Documentation & Functional Details

Textual and visual (including video) detailed examples on how to use the TSDMS to to perform tasks on time series data.  


Bulk Import

Import one or many raw data files and easily add valuable metadata from the filename, folder / path, and custom metadata to the files.   The TSDMS will automatically structure the imported data to maximize it's value and functionality.   Bus Log data from CAN, LIN, and FlexRay data files are significantly easier to import because the bus log database files, bus numbers, and ID mode are iteratively scanned to identify the import configuration that yields the most bus log messages.  

Before importing raw data, it is necessary to perform a minor amount of preparation, that consists of isolating similar files into a single folder, identifying any required supporting files (bus log database), and defining any custom metadata that should be added to the files.  

Advantages of Using Bulk Import

  • Import thousands of files robustly in one batch
  • Simple metadata enrichment
  • Channel structure optimization
  • Easy Bus Log Conversion

Extracting metadata from raw data filenames, folders, and specifying custom metadata to add to the files imported is extremely easy.   Enriching your files with metadata makes it possible to categorize your files by multiple criteria, enabling a flexible and powerful search capability.   When the metadata applied to the categorization of the data is specific and consistent, then the maximum search performance may be realized.   The user interface for adding custom data makes is very easy to input consistent values, because any prior values or numerical min/max values are shown by Bulk Import when you define the categorization criteria.   In the best scenario, a date stamp is included somewhere in the filename and it will be automatically identified and assigned the TSDMS standard property name "Date_Recorded".  

Each raw data file is imported by a separate instance of DIAdem (parallel process / worker), maximizing the robustness of the process.   The eliminates any memory constraints that can occur when multiple large files are imported, and limits any import failures to the individual file, rather than the entire batch.  

Channels are automatically structured into 2D or 3D data structures based on the content identifed.   This results in making it considerably easier to generate visualizations in View and Report since you may simply drag and drop a y-channel into a chart object and the proper x-channel and any z-channel assignments will be automatically assigned   [1].  

Waveform channels are always converted automatically to numeric channels.   Numeric is preferred over waveform channels because waveform channels don't support non-linear 'Time' channels (frequency), and some DIAdem Analysis tools operate faster and cleaner with numeric channels as the input. .  

The primary x-channel will be automatically identified and established by Bulk Import.   A numeric time channel will always exist for the channels in a channel group.   If it is not linear, then it will be created from any existing DateTime channel.   DateTime channels are retained if the time zone reference is anything other than 'unknown' (see DateTimeOffsetFromUTC), otherwise the values would be ambiguous.   The offset from UTC is defined during Bulk Import by user.  

A hash is calculated on the raw data of every file imported by Bulk Import, and another is calculated based on the date/time of the import activity.   These hash values are stored in the TDMS files and may be used to uniquely identify the files by content (to prevent duplicates under different filenames), and to identify all of the files that were imported at the same time.  

Bus log conversion is made dramatically easier by Bulk Import.   Any bus log database files in the same file as the source files are automatically identified.   Bulk Import will automatically identify the bus numbers (0 to 255) and the ID mode that yields the most decoded messages from each bus log database file.  

The following raw file types will also be manipulated as discussed to enhance the value of the data:  

  • HBM / Somat .SIE   If DataPlugin is 'SoMat_SIE' and Bulk Import conversion option chosen by the user is 'Analog + Bus Log Conv', then the bus log conversion will be conducted first, and then the import of the analog data will be performed with the "SoMat_SID" DataPlugin.   The two files will be then merged, and then saved to a new TDMS file.  
  • LeCroy oscilloscope .TRC.   Each waveform channel will be converted to numeric channels, including a y-channel, a numeric time channels with units in seconds.  

[1]   This feature only works when TSDMS is running.   When the full capabilities of DIAdem are exposed, then the automatic recognition of 2D & 3D structures are not enabled.  

Generate Sample Raw Data Files

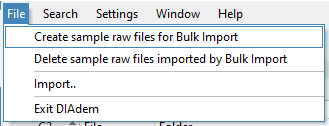
The TSDMS includes a tool that will automatically generate sample raw data sets that can then be imported using Bulk Import.   It is highly recommended you generate these files and the import them with Bulk Import the first time you use the system.   A TSDMS menu option will allow you to easily delete these sample data files from the system when you are finished performing initial tests with them.   Two sets of files are created, 24 ATFX files with a variety of channel types, and one bus log file of type NI-CAN file (.ncl) and one associated bus log database file (.dbc).   These two sets allow you to test how Bulk Import can be used to import analog data (ATFX) and bus log (NI-CAN) data via Bus Log Conversion.  

To generate the sample raw data, choose the menu options 'File', 'Create sample raw files for Bulk Import'.  

create sample big data files

The files will be saved in this folder structure:

  • ...\DAQ\2022\Lab Test\CA\NI PCI-8512
  • ...\DAQ\2021\Field Test\CA\DewesoftSirius

Why Do I Need To Import Data?

Importing converts raw data files using a DataPlugin and/or using Bus Log Conversion into a binary file that is optimized for for the storage of measurement data, and the metadata that describes the contents of the file.   The TDMS file is an open binary file format that provides superior read/write performance, minimizing the time to perform data analysis, and the generation of visualizations.  

DataPlugins

NI DIAdem supports the import of over one thousand raw data file formats through their DataPlugin technology.   If the DataPlugin you need is not shown by Bulk Import, then you will need to visit NI's DataPlugin Download website online and download and install the DataPlugin.   Read more about NI DataPlugin technology here and here.  

Bus Log Conversion

NI DIAdem has a Bus Log Converter to convert raw CAN, LIN, and FlexRay data files into the TDM data file format.   Bulk Import dramatically simplifies the process of importing logfiles from CAN, LIN, and FlexRay buses by iteratively discovering the combination of bus log database file(s), bus log numbers (0 to 255), and ID mode that result in the most number of decoded messages.   Bulk Import also intelligently reduces the scope of configuration choices for Bus Log Conversion by sorting out what options are appropriate based on the source bus log raw data type, and bus log databases included with the set of files.  

Preparing Raw Data For Import

Isolate the set of raw measurement data files into a folder, along with any bus log database files if Bus Log Conversion is involved.   Do not include any files with extension .txt, .csv, or Excel files with the raw data, since these can be confused with raw measurement data files themselves.   You may include Rich Text Format files with the .rtf file extension without concern for conflict.   If you have any information that describes when, where, and how the data was collected / recorded, then you should have that information available before initiating Bulk Import.  

Bulk Import Step by Step Guide

Jump to:   Analog Data   Bus Log Data   Bus Log & Analog Data  

Bulk Import Analog Data

The first time you use Bulk Import, begin by generating sample raw data files.  

Prepare the raw data files for import by placing similar files within a new independent folder.   The script that generates the raw sample files will automatically do this for you.  

To start Bulk Import, either click on the Bulk Import toolbar icon, or select the file menu option 'File', 'Import...'.  

The Bulk Import dialog will initialize, and then appear.   An 'Intro' tab will appear with instructions about preparing the data for import.   Click the 'Next' button to continue.   From the 'Source' tab, select the source folder with the raw files by clicking on the button with the '...' label to the right of 'Folder'.  

Bulk Import big data

NOTE: The sample data files are located in this folder structure:

  • ...\DAQ\2022\Lab Test\CA\NI PCI-8512
  • ...\DAQ\2021\Field Test\CA\DewesoftSirius

The 'DataPlugin' drop-down list will automatically select the appropriate DataPlugins based on the file extensions of the raw data in the folder.   If multiple DataPlugins exist, then you will need to select the appropriate DataPlugin.  

TIP: If you are not sure of what DataPlugin to use, then create a folder with a single raw data file, and try each option until you have a positive result.  
For the sample raw ATFX files, select the DataPlugin 'ATFX'.   Click the 'Next' button to continue to the next tab named 'Filename'.  

Import big data using NI DataPlugin

The 'Filename' tab allows you to easily extract metadata from the raw source filenames.   If a non-ambiguous date pattern is found, it will be automatically extracted and added as the metadata key 'Date_Recorded'.   Click on the 'Parsing delimiter' drop-down list to choose a character that will divide up the filename into parts that can become metadata values for a user specified keyword.  

time series data metadata extraction

The list of filenames will update with the parsed results based on the parsing delimiter chosen.  

big data metadata extraction

Click on the 'Next' button at the bottom of the dialog when finished to move to the 'Folder' tab.  

Click on the top header of each column in the table.   A dialog will appear, allowing you to specify the property name / key for the rows below it, and the data type (text, numeric, date/time).   It will also allow you to delete the column.   Note that any previously defined property names will appear in the drop-down list, but you may also always create a new property name.   Note that the 'Property data type' drop-down list can intelligently derive numeric values from a value such as '110.3 hours'.   Date/Time values entered according to ISO 8601 & RFC 3339 standards (Example: 2021-08-02T05:32:06+00:00), will be converted from text and stored as a date/time value.   If a numeric or date/time conversion fails, then the property data type will default to text.   Note that you can use the ~ tilde character to create property name groups.   For example, property names 'Test~Product' and 'Test~Implement' will be grouped under the property name 'Test' and then the children 'Product' and 'Implement' will be under 'Test'.   This provides a convenient means to group and organize your metadata.  

metadata extraction and categorization

metadata extraction from big data filename

On the 'Folder' tab, any metadata from the Windows OS path to the source folder can be easily added to the data files.   Click on the table row in the 'Property Name' column to open up the same editor used previously to define a property name and data type, or to delete the table row.  

extract metadata from source folder path

categorize metadata from source folder path

The 'Custom' tab allows you define your own properties (key/value pairs) to add to the file.   The user interface is slightly different for this tab, as the property name and value is defined directly above the table of metadata.   The data type is derived automatically by the TSDMS based on the value contents / formatting.   All numeric values will be assigned to the numeric data type.   Date/Time values must follow the ISO 8601 & RFC 3339 standards in order to be recognized and assigned as date/time data type (Ex. 2021-08-02T05:32:06+00:00).  

TIP: The properties you enter here are saved to a JSON file where the source files reside.   You may include this in new sets of data later to make it easier to include metadata that is common to many data sets.  

custom metadata attribution

The last tab 'Time Zone' allows you to define the time zone associated with any date/time values for the metadata, or the values saved within the file itself.   This property named 'DateTimeOffsetFromUTC' is the offset in hours and minutes between the local time and UTC.   Time zone identification of your data is critical when you share your data globally, or when you try to identify weather and other conditions at the location and time when the data was recorded.  

specify time zone

At this point all of the metadata to be added to the files has been specified.   Click the 'OK' button to begin import of the files and enrichment with metadata.   This process can take some time, depending on the size and number of the files.   When Bulk Import is complete, a search will be created to show the files just imported by using the unique identifier for the set of files (ImportBatchHash).   A check will also be performed to see if any files in the system are duplicates (based on a hash of the raw file).   Duplicates with the exact same filename are always overwritten immediately.   But if a source file is renamed and imported, then it can only be identified as a duplicate by the hash of the raw file (SourceFileHash).   If any duplicate file sets are found, you will be given the option to delete the duplicate set.  

start big data import

begin time series data import

Bulk Import Bus Log Data

Bus Log Conversion is dramatically simplified by using Bulk Import.   Bulk Import will scan the CAN/LIN/FlexRay bus numbers and interatively identify those that yield bus Log data.   It will also determine the ID Mode (J1939 or Default) that produces the best conversion results.  

Bulk Import creates a file named 'BusLogConvConfig.tcc' in the source folder that contains the information to perform Bus Log Conversion.   This file is NOT compatible with DIAdem's bus log conversion configuration .tcc XML file, and therefore should not be used to perform a manual Bus Log Conversion.   The extension .tcc was selected over .xml because .xml is a bus log database file extension.  

The first time you use Bulk Import, begin by generating sample raw data files.  

Prepare the raw data files for import by placing similar files within a new independent folder.   The script that generates the raw sample files will automatically do this for you.  

To start Bulk Import, either click on the Bulk Import toolbar icon, or select the file menu option 'File', 'Import...'.  

The Bulk Import dialog will initialize, and then appear.   An 'Intro' tab will appear with instructions about preparing the data for import.   Click the 'Next' button to continue.   From the 'Source' tab, select the source folder with the raw files by clicking on the button with the '...' label to the right of 'Folder'.  

CAN LIN FlexRay bus log conversion

NOTE: The sample data files are located in this folder structure:

  • ...\DAQ\2022\Lab Test\CA\NI PCI-8512

  • ...\DAQ\2021\Field Test\CA\DewesoftSirius

The 'DataPlugin' drop-down list will automatically select the appropriate DataPlugins based on the file extensions of the raw data in the folder.   If multiple DataPlugins exist, then you will need to select the appropriate DataPlugin.   If the DataPlugin supports recording both analog data and bus log data, then you will need to make a manual choice from the radio buttons between the choices of 'Analog only (no bus log coversion)', 'Bus Log Conversion (only)', and 'Bus Log Conversion + Import Analog Data'.   If the file extension is associated with only bus log data, then the appropriate DataPlugin and radio button will be automatically selected, and the tab will change directly to 'Bus Log Conv'.  

CAN LIN FlexRay bus DAQ type

The sample data set with the NI-CAN data file will cause the dialog to go directly to the 'Bus Log Convert' tab, and to automatically begin building of the bus log conversion configuration.   NI bus log files are a unique case where it is not necessary to interatively determine the bus numbers (0 to 255) and mode, like it is for other bus log files.   Review the bus log conversion configuration that was automatically determined, and then click the 'Next' button to move to the 'Filename' tab.  

CAN LIN FlexRay bus number

See the next example 'Bulk Import Bus Log & Analog Data' for an example of using the 'Build Bus Log Conversion Configuration' option for any other non-NI type bus log conversion files.  

The remainder of the process of Bulk Import is exactly the same as the steps previously described for analog only data, beginning with the 'Filename' tab (<- click on link to jump to that location).   These steps assist in the extraction of metadata from the filename and folder, adding custom metadata, and defining the time zone for the data set.   The screen image below shows the imported NI-CAN sample data file in the search results.  

CAN LIN FlexRay bus conversion

Bulk Import Bus Log & Analog Data

Bulk Import of data from a raw file that was recorded by a data logger / data acquisition device that supports the recording of analog and bus log data is for the most part the same as the two individual steps performed sequentially.   The only difference is the output from both import / conversion activities is automatically merged into a single TDMS binary data file by Bulk Import.   The sample data files that come with the installation of DIAdem don't include a Bulk Import Bus Log & Analog Data data file, so the examples in this section cannot be replicated in your installation of the TSDMS unless you have those data files yourself.   When using the Bulk Import feature of the TSDMS, the user need only select the appropriate option 'Bus Log Conversion + Import Analog Data'.

The image below shows an example where Bulk Import has automatically recognized that the NI cRIO data acquisition hardware can support both analog and the recording of CAN/LIN/FlexRay bus data (or only analog, or only CAN/LIN/FlexRay bus).   In this case, it is the responsibility of the user to make the correct choice from the radio button options.  

CAN LIN FlexRay bus log data plus analog data

Bus Log Conversion is dramatically simplified by using Bulk Import.   Bulk Import will scan the CAN/LIN/FlexRay bus numbers and interatively identify those that yield bus Log data.   It will also determine the ID Mode (J1939 or Default) that produces the best conversion results.  

From the 'Bus Log Convert' tab, the drop-down lists labeled 'CAN bus numbers', 'LIN bus numbers', and 'FlexRay bus numbers' allow you to select the range of bus numbers for each to be interatively scanned by Bus Log Convert.   Each of these drop-down lists will only be enabled if corresponding bus log database files are found in the source folder.  

CAN LIN FlexRay bus number

Click the button labeled 'Build Bus Log Conversion Configuration' to begin creating a bus log conversion configuration.   The configuration file created will be used later by Bulk Import to bus log convert every bus log file in the source folder.  

TIP: Set the range of bus numbers to the smallest range between 0 and 255 for each CAN/LIN/FlexRay bus.   Performing a bus log conversion with each option, plus determing the best mode can take considerable time.  
The image below shows the dialog state prior to clicking the 'Build Bus Log Conversion Configuration' button.  

automatic bus log conversion

The image below shows the dialog after the 'Build Bus Log Conversion Configuration' button has been clicked and the configuration build is complete.   Bulk Import will automatically create copies of the bus log database files when necessary to support bus log conversion of different bus numbers from the same bus log database file.  

CAN LIN FlexRay bus log database

Bus Log Conversion File Formats Tested

Tested Analog File Formats

File Extension DAQ Source
.TDMS NI cRIO
.LVM LabView
.MF4 MDF v4.0 (export from DIAdem)
.D7D DEWESoft7 TESTED????
.SIE HBM/SoMat
.SIF HBM/SoMat older binary file format.
.TRC LeCroy oscilloscope
.BIN Telemaco
.CSV A comma separated value (CSV) text file format.
.ATFX ASAM Transport Format (XML).   v1.1.0 & v1.4
.GPX GPS log file
.NMEA NMEA GPS


Tested Bus Log Conversion File Formats

File Format
.TDMS cRIO CAN bus 1 & 2
.NCL NI-CAN
.TDMS NI XNET CAN bus #1; LIN bus #1; FlexRay bus #1
.BLF Vector GL3000 CAN bus 1 & 2, LIN bus 1 & 2
.ASC Vector ASCII file format with CAN bus 1 data
.BLF Vector CANcaseXL CAN & LIN bus
.MF4 MDF4 CAN1 & CAN2 data recorded by CSS Electronics CANedge2 data logger
.ASC CSM CAN bus 1 & 2
.SIE HBM / Somat ECOM layer CAN bus 1 stream
.DAT Campbell data logger

FAQ

Why is a search for duplicate files (by content) performed after the files are imported?

A hash of the source file content is calculated for the raw files.   This calculation can take a lot of time for large files.   It is more efficient, and flexible to import the files, and then resolve what to do with any duplicates found.  

What is 'My DataFinder' and what is a DataFinder?

A DataFinder is an indexing service that creates a database of the metadata and file contents (filename, channel group name, channel name).   The DIAdem Navigator interface connects to a DataFinder and allows you to perform a search of the database, allowing you to find files, channel groups, and channels of interest based on your search criteria.   The DataFinder 'My DataFinder' is a local DataFinder that supports a standalone installation of DIAdem on a user's PC, and the indexing of files on that user's PC.  


Search by Metadata

A simple dialog presents the file metadata and values (added during Bulk Import), and you need only interactively choose the filter criteria.   Keywords are selected from a drop down list.   Next, you choose an operator (=,<>,=>, =<).   And finally a value from either the existing values in the system, or a custom value.   If you 'Cancel', then the original search conditions are restored.   A 'Find All' button will create a search for all files.   The date relative range # operator (Yesterday, Last 7 Days, ..) is not supported.  

Step by Step Guide

Access the Search by Metadata application by clicking on the toolbar from the Navigator panel, or from the menu 'Search', 'Find by metadata..'.  

search big data by metadata

The Search by Metadata application runs with the Navigator search interface and search results shown in the background.   The application makes it very easy to create a search, and you can learn about how a search is built by simply observing the changes to the search interface as you work with the Search by Metadata application.   Click on the 'Find All' button to create a search that finds all imported data.  

big data metadata search technologgy

Click on the drop down list labeled 'Property' to see a list of all the metadata by keyword (file property name) added during Bulk Import.  

list of all metadata from files

Note that the NI DIAdem Navigator search interface is fairly easy to use.   After using Search by Metadata a few times, you will likely begin using the Navigator advanced search user interface directly.   This is highly ecouraged, because Search by Metadata was created only created to make searching very easy to perform for a first-time beginner.  

A Note About Inconsistent Metadata Across All Files

Some of the metadata you provide through the Bulk Import application will have the same property across all of your files (keyword the same, but possibly differrent values).   In other cases, only certain batches of files imported will have a property, and other files will not.   In the case where a property doesn't exist across all files indexed by the system, the search by metadata behaviour will be consistent with what you expect.  

For example, suppose you have a file property named 'Latitude' assigned to some of your data files.   If the values assigned to those files are numeric (floating point), then when you search for files with "Latitude >= 40", the search results will include all files with a latitude value greater than or equal to 40 (and the files with Null assigned will not be returned).   If you search for files with "Latitude < 40", the search results will NOT include those files with a null value (as expected).  

Similarly, if a file property named 'FileSequence' with data type numeric (integer) is assigned to some, but not all files, then a search for "FileSequence <> 0" will return a list of all of the files.   A search for "FileSequence < 10" will return only the files with property values less than 10.  

If the file property is of data type text and named 'Source', then if you searched for "Source = ∗", then you would get all of the files if that was the only search filter (as expected).  

If the file property is a data type of date/time, then files without a property and value assigned, will be omitted from any search results.  

FAQ

During Bulk Import, I added a custom metadata with a date.   But when I do a search, I have I am unable to search it like I can other dates.  

The date you entered was probably not formatted correctly and stored as a text value, rather than a date/time value.   It must be formatted according to ISO 8601 & RFC 3339 standards in order for the text to be recognized as a date/time value.   Example: 2021-08-02T05:32:06+00:00     Bulk Import your data again with this correction in order to correct the data type for this file property.   NOTE: All imported instances with this property name must be corrected in order for all values to be indexed as a date/time data type rather than as text.  


Bulk Analysis

This application will allow you to perform a statistical analysis on one or more channels, for all of the files in the search results.   The results from the analysis can then later be chosen to be included in the report generated by Bulk Report.  

TSDMS version 0.0.x will include channel statistics for 2D data structures such as sum, sum of squares, minimum, maximum, arithmetic mean, square mean, geometric mean, harmonic mean, lower quartile, median, upper quartile, range, standard deviation, variance, variation coefficient, quartile distance, relative variation coefficient, average absolute deviation from mean, average absolute deviation from median, skewness, kurtosis, standard error, excess kurtosis, 0.025 quantile, and 0.975 quantile.   For 3D data structures, the maximum and minimum can be calculated across all Z Channels.   The Z channel that has the maximum / mininum, and the exact position (can be referenced to the time / datetime channel) is also identified.   See the Road Map for a complete upcoming feature release schedule.  

Step by Step Guide

To start Bulk Analysis, first execute a search to define the set of files that you want to perform the Bulk Analysis on.   Then click on the Navigator panel toolbar as shown in the image below.  

big data analytics via Bulk Analysis

This tutorial is based on the 24 ATFX sample files generated from the data set folder named 'DeweSoftSirius'.   It will be easier to follow this tutorial if you have executed the menu option to create these files, and then used Bulk Import to import them.  

When Bulk Analysis starts, it will check the search results and insure that at least one set of channels are common among all of the files.   This prevents you from starting an analysis that will fail to generate a complete analysis of the set of files from the search results because one or more of the files doesn't have any channels in common with the set.   The check can take some time if you have many search results, but the check will insure that you don't attempt to perform an analysis on a set of files that don't have consistent channel contents.   The message bar at the bottom of the DIAdem application window will display the progress of the search.  

When the channel consistency check is complete, the Bulk Analysis application will run and will appear as shown below.   The first file from the search results is loaded into the Data Portal (shown on the very right).   The application is non-modal, so you may click on and explore the Data Portal contents as needed.  

big data analytics bulk analysis channel consistency check

Choose a numeric Y-Channel from the Data Portal by clicking on it, and then drag and drop it into the Bulk Analysis 'Input Channels' field labeled "Y Channel".   Bulk Analysis will allow you to only drop 2D and 3D numeric channels.   The X Channel will be automatically identified.   If the data structure is 3D, then the Z Channels will also be automatically identified and assigned to the appropriate field in the dialog.   Note also that on the 'Y Stats' tab, the button below labeled "# of # statistics..." will be enabled after a 2D channel is dropped into the Imput Channels area.  

big data analytics of 2D and 3D data

Click on the button labeled "# of # statistics..." on the 'Y Stats' tab to see a list of statistics that can be performed on the Y-Channel.   Choose 'Minimum', 'Maximum', and "Arithmetic Mean' by checking the corresponding checkboxes.   Click the 'Done' button when finished.  

big data 2D statistical analysis

The button on the 'Y Stats' has been updated to show that three out of a possible 29 statistics have been chosen.   Click on the 'Analyze 24 Files' button at the bottom right of the Bulk Analysis dialog to perform the analysis on all of the files in the search results.  

time series data statistical analysis

You will be notified when the analysis is complete (see below).   Thereafter, you can click the 'Close' button to exit, or you may drag and drop another channel into the 'Input Channels' 'Y Channel' input field, repeating the process.   Repeat the channel analysis on the channels 'RPM', 'Torque', and 'Power' from the channel group 'NumericLinear'.   Choose any statistic such as 'Maximum' for each.   This will configure the files so you can explore the Bulk Report options later.  

big data channel statistical analysis

In the Data Portal, collapse the channel group 'NumericLinear' and expand the channel group named '3D_XYZ' by clicking on them.   Drag and drop the channel 'Y_channel' from the Data Portal to the Bulk Analysis dialog 'Input Channels' 'Y Channel' field.   Bulk Analysis will recognize this as a 3D channel structure and automatically assign the X and Z channels.   Note that the 'Y Stats' tab button '# of # statistics' button is enabled, allowing you to perform statistics just as before on the Y Channel of the 3D data structure.  

time series data 2D statistical analysis

Click on the 'Z Stats' tab and then check both statistic options of 'Z channel minimum' and 'Z channel maximum'.   These choices will find the min/max among all of the twenty Z Channels, and it will identify the channel with that min/max, and the location within the channel where it occurs.  

big data 3D statistical analysis of maximum and mininum

'Click the 'Analyze 24 Files' button at the bottom right of the dialog to perform the Bulk Analysis.   Click the 'Close' button when finished.   From here, it is suggested you run the Bulk Report application to see the analysis results.   Alternatively, you can see the analysis results by inspecting the channel properties under 'Result~...' within the Data Portal.  

FAQ

What do the MatMaxCol, MatMaxRow, MatMinCol, MatMinRow values mean for 3D data?  

They identify the exact location in the file where the minimum / maximum occurred.   For example if the MatMaxCol = 20, then look in the 20th Z Channel ('Z_channel_20' from the tutorial example), and then the position of the maximum in that channel will be located at the channel row specified by MatMaxRow.  

big data analytics of 3D data

big data analytics Z channels


Bulk Report

Bulk Report enables you to easily create professional looking visual reports with valuable information about your time series data from a set of one or more files with similar channel content.   From a set of search results, you can prepare two types of reports.   The first type of report consists of a Single Page Per File with 2D/3D charts and channel analysis results generated from each search result / file.   The second type of a report is a Data Set Summary that collects a channel's analysis results across the entire set of search results / files.   The values are plotted to a 2D chart, and then a user specified statistical calculation is performed on the values, and added to the report page.   Any of the metadata added to the files from Bulk Import may be easily included in the report's header, footer, title, and subtitle.   The generated reports may be printed, or exported as a PDF, image, XPS, HTML, or PowerPoint file.  

Bulk Report expects you to perform all of your report layout and chart formatting in the report layout file prior to running Bulk Report.   This gives you the most flexibility in the ability to format the apperance of your reports, using DIAdem's powerful report editing tools.   Using Bulk Report with your customized report layout accelerates the generation of many reports from a set of data files with similar channel content (relative to what will be used in the report).  

Jump to:   Single Page Per File Report   Data Set Summary Report  

Sample of report generated by Bulk Report - Single Page Per file.

TSDMS Bulk Report Single Page Per File

Sample of report generated by Bulk Report - Data Set Summary.

TSDMS Bulk Report Data Set Summary

Step by Step Guide

Launching Bulk Report

From the Navigator panel, click on the Bulk Report toolbar labeled as "Generate a report from all files in the search results (Bulk Report)" when your mouse hovers over it.  

The Bulk Report application chooser will appear.   Use the radio buttons to choose what application to launch.   Additional information about each application is provided to assist in making the correct choice for your needs.  

Both Bulk Report applications will examine the contents of the search results to to confirm that the channels in the files are consistent in terms of channel content.   If this test fails, then the dialog below will be shown, warning you of this situation.  

Jump to:   Single Page Per File Report   Data Set Summary Report  

Single Page Per File Report

The Single Page Per File report may contain one or more 2D/3D charts of the file's channel data, along with a user specified channel analysis result value (maximum, minimum, average, ...) calculated for the channel displayed on the report (generated by Bulk Analysis).   The only restriction is that the set of search results (files) used as input to Bulk Report must have the same channel content and Bulk Analysis results for the content that will be included in the report (Bulk Report will check to be sure this is true).  

The layout of the Single Page Per File report is chosen from a set of pre-defined Report templates that may be edited and customized manually prior to Bulk Report execution.   Any template that has a chart with multiple curves (generated from channel data) may be reduced in number dynamically during the report generation process.  

This tutorial uses the sample raw data files that you may optionally create from the TSDMS menu 'File','Create sample raw files for Bulk Import', and then import using Bulk Import.   Specifically, you should create a search that contains only the 24 analog ATFX files in the search results.   You should have also performed Bulk Analysis on this set of files as previously described in order to see the analysis results added to the report (but technically, it is possible to generate a Single Page Per File Bulk Report without running Bulk Analysis first).  

A default filename and location is automatically assigned for the PDF file to be created.   Change the PDF filename and location if desired.   A report template formatted for Bulk Report is required.   Click on the button to the right of the 'Report template' field to pick a report report template from the default set that comes with the TSDMS installation.   For this tutorial, choose the template named 'BulkReport_SPPF_portrait_DEMO_3x2Dcht_1x3Dcht.TDR'.   This template contains one 2D chart with 3x curves, two 2D charts with 1x curves, and one 3D chart.  

Bulk Report export to PDF file

The Report panel will be shown and the report template will be loaded.   The first file from the search results will also be loaded into the Data Portal (memory).   The Bulk Report is non-modal, so you may interact with the Data Portal as necessary in order to expand channel groups so you may see the channels within them.   The four report chart objects (Cht2DObj1,...) are listed on the 'Charts' tab under 'Report Charts'.   These have been identified from the report template.  

NI DIAdem report layout

Click on the first Report Chart object named 'Cht2DObj1' as shown below.   This action will enable the button 'Identify chart object on the report', and the drop down list labeled '2D Chart Ch2DObj1' Curve No'.  

NI DIAdem report 2D 3D chart

Choose Curve No. 1 from the drop down list.   This action will enable the input field to the right for 'Y Channel' under 'Channel assignments to Cht2Dobj1 Curve No. 1'.   In the Data Portal, click on the channel named 'Speed' in the channel group named 'NumericLinear' and drag and drop it into the 'Y Channel' input field.   This action assigns the channel 'Speed' to Curve No. 1 in the 2D chart 'Cht2Dobj1'.  

time series chart curve assignment to channel

Click on the button under 'Channel Analysis Results' and select the 'Maximum' statistical result to be included in the report.  

Choose statistics to include time series data report

Click on the Curve No. drop down box and select Curve No. 2.  

time series chart curve

Drag and drop the 'RPM' channel from the 'NumericLinear' channel group into the 'Y Channel' input field.  

Click on the Curve No. drop down box and select Curve No. 3.   Drag and drop the 'Torque' channel from the 'NumericLinear' channel group into the 'Y Channel' input field.  

Click on the Curve No. drop down box and select Curve No. 4.   Drag and drop the 'Power' channel from the 'NumericLinear' channel group into the 'Y Channel' input field.   At this point, the first 2D chart in the upper left of the report now has all four curves assigned a channel.  

At the Data Portal, collapse the 'NumericLinear' channel group and then expand the channel group named 'Spikes'.   Drag and drop the channel 'NitrogenOxide' to the Bulk Report 'Y Channel' field.  

time series 2D chart curve channel assignment

Repeat the process, assigning the channel 'Noise Voltage' from the 'Spikes' channel group to the Curve No. 1 in the report chart object named 'Cht2dObj3'.  

Click on the Report Chart object named 'Ch2DObj4'.   This chart is the 3D chart in the lower right of the report sheet (click on the button 'Identify chart object on report' if you wish to confirm this).   In the Data Portal, try dragging and dropping the 'RPM' channel in the channel group named 'Spikes' to the Bulk Report 'Y Channel' field.   The action will NOT be permitted because it recognizes that the report chart should only be assigned a channels with a 3D data structure.   In the Data Portal, collapse the 'Spikes' channel group and expand the '3D_XYZ' channel group.   Drag and drop the channel named 'Y_channel' to the Bulk Report 'Y Channel' input field.   Note that the X Channel and Z Channels are automatically assigned (this is the benefit that the TSDMS Bulk Import provides).  

time series 3D chart

Across from the 'Z Channel', click on the corresponding button under 'Channel Analysis Results' (labeled 0 items of 6 included ...' and check the following items: 'MatMax', 'MatMaxCol', 'MatMaxRow'.   This will add the maximum value and the position of that value within the 3D data structure to the report under the report field named 'CommentsRight'.  

time series 3D chart Z channel statistics

All four charts now have channels assigned to all of their curves.   Some of the channels have statistical results identified to be included in the report.   Click on the button labeled 'Edit Report Labels'.   The 'Comments Left' and 'Comments Right' labels are disabled because they will be assigned the Y Channel and Z Channel statistical results, respectively.   Click on the drop down list box to the right of 'Header Left' and select the 'Source: ...' option.   This causes that value to be added to the input field immediately to the right of the 'Header Left' label.   Notice that this list consists of the metadata added during Bulk Import, but it only includes the metadata that is the same among all of the search results.  

time series chart report labels

Click on the drop down list to the right of 'Footer Middle' and choose the 'Page # of #' option.   Click on the drop down list to the right of 'Footer Right' and choose the 'Report DD MMM YYYY' option.   Click on the input field immediately to the right of 'Title' and type in "NH 25S Tractor".   Click on the input field immediately to the right of 'Sub Title' and type in "2021 Field Test in CA".   You have now defined the labels that will appear on every report page to be created (one each report page per search result file).   Click on the button at the bottom right labeled 'Start Bulk Report Generation'.  

big data report labels

Initially the progress of the Bulk Report generation will be shown at the bottom left of the DIAdem application message area.   Later, you will see each file from the search results loaded and each report page generated.   Note that the channel group 'Spikes' contains channels with many values, so it will take some time to plot all of those values to the 2D charts.   Fortunately, you don't need to perform all of these actions manually, you can walk away and return later when the process is complete.   When the report generation is complete, the Bulk Report application will attempt to find the PDF viewer application installed and use it to load the PDF report.   Below is an image of the first page from the PDF file shown in a PDF viewer.   Notice that the 'Speed' channel maximum value is shown at the lower left of the report page, and the channel 'Z_channel_1' maximum value and location is shown at the lower righ of the page.  

time series chart report configuration

You can customize the appearance of the report template, adding your own logo, and changing the formatting of the charts by following the steps in the tutorial How To Customize Report Templates.  

FAQ

Why are the buttons to add statistical results to the report disabled for some channels?

You need to run Bulk Analysis on those files/channels to generate the statistical results prior to running Bulk Analysis.

Can I assign a channel to more than one chart on a report page?

A channel may only be assigned to a single 2D chart curve per report layout page.

Can I assign channels from different channel groups to the same 2D chart with multiple curves?

If multiple curves exist in a 2D chart, then all channels assigned must be from the same channel group (common X Channel).

Can I define custom X,Y labels for a 2D chart with multiple curves?

If multiple curves exist in a 2D chart, you cannot assign custom X,Y labels, they must be the channel names from the file.

Why are my channel statistical results are overflowing off of the report page?  

Selecting too many channel statistical results to be shown in the report will overflow the text object that holds them.

Can I assign channels from two or more files to the same report page?

Only one file / search result per report page.

The 3D chart on the report template is named 'Ch2DObj4', but it is a 3D chart, so shouldn't the name be 'Ch3DObj4'?

You are correct, it should have been originally configured to be more generic, using a name such as 'ChtObj#'.   It doesn't adversely affect Bulk Report.   However, never rename the chart on the template named 'Ch2DObj1' to something else.  

Report Layouts That Come With The Installation

BulkReport_SPPF_landscape_1x2Dcht.TDR

time series data management system Bulk Report 2D landscape


BulkReport_SPPF_landscape_1x3Dcht.TDR

time series data management system Bulk Report 3D landscape


BulkReport_SPPF_portrait_1x2Dcht.TDR

time series data management system Bulk Report 2d portrait


BulkReport_SPPF_portrait_1x3Dcht.TDR

time series data management system Bulk Report 3D portrait


BulkReport_SPPF_portrait_4x2Dcht.TDR

time series data management system Bulk Report 4x 2D chart


BulkReport_SPPF_portrait_4x3Dcht.TDR

time series data management system Bulk Report 4x 3D chart


BulkReport_SPPF_portrait_DEMO_3x2Dcht_1x3Dcht.TDR

time series data management system Bulk Report 3x 2D chart + 1x 3D chart


BulkReport_SPPF_portrait_DEMO_6x3Dchts.TDR

time series data management system Bulk Report 6x 3D chart


Data Set Summary Report

The Data Set Summary application collects a single numerical calculated channel result from every file in the search results, plots it to a 2D chart, and then performs a user specified statistical calculation on the values and adds the result to the report page.   You may generate multiple report pages, one each for a chosen channel statistical result.   The single numerical calculated channel result is generated by using the Bulk Analysis application.   Within the application you will choose what statistical calculation will be performed on the extracted channel result values (23 options such as maximum, minimum, mean, median, etc.).   The content of headers and footers of the report page for the data set may be customized.   Default report templates are included for portrait and landscape page orientation.   Advanced users may customize copies of these report templates, adding a logo, etc. to the report page.  

For example, if the channel statistic 'maximum' is calculated for a channel across all data files, then that maximum value may also be plotted to a 2D chart with the file's hash value for the X-axis, and the maximum value for the Y-axis.   A user chosen statistical result calculated from the set of maximum values (maximum, mininum, mean, median, ...) will also be calculated and displayed on the report page.  

The first time you run the Data Set Summary Bulk Report application, a default report template that comes with the installation will be found and loaded.   Click on the button labeled '...' to the right of 'Report template' to change the report template loaded.   You will see the report template loaded in the background.   The first file from the search results has already been loaded, and all of the channel result statistics previously calculated by Bulk Analysis are extracted and shown in the list under the label 'Channel Statistical Results' on the left middle of the dialog.   The list consists of the channel group / channel name followed by the | character, and then the channel statistical result property name.   Click on a channel statistical result such as 'Numeric/Speed | Result~Statistics~ExtremeValues~Maximum'.  

time series chart Bulk Report data set summary

The list of statistical calculations that may be calculated on the single statistical result per file is listed on the right under 'Statistic To Calculate Across Results Per File'.   Click on the 'Maximum' option and then click on the button 'Add to Report'.   This action will extract all of the maximum channel results from each file, build a channel in the data portal with those results, and then calculate the maximum from those values.  

time series chart statistical results to include in the Bulk Report

You may continue to select additional channel statistical results for the report, or you may click the button 'Edit Report Labels' to finalize the report labels for the report.   Lets add one more statistical result.   From the list under 'Channel Statistical Results', click on 'Spikes/RPM | Result~Statistics~ExtremeValues~Maximum' and then from the list on the right labeled 'Statistic To Calculate Across Results Per File' choose 'Arithmetic Mean'.   Click the button 'Add To Report'.   Wben that action is complete, click on the button 'Edit Report Labels'.  

These are the labels that will appear on every report page (one page per file / search result).   The metadata shown in each drop down list is limited to those where the value is the same across all of the files in the search results.   Click on the drop down box for 'Footer Middle' and choose 'Page # of #'.   Click on the drop down box for 'Header Left' and choose the option 'Test~Product: NH 25S Sub-Compact WORKMASTER Tractor'.   Note that the 'Title' and 'Sub Title', and 'Comments Left' are disabled.   They will automatically be updated with the channel name and statistical result name.   The statistic calculated across all of the search results will appear in the 'Comments Left' location on the report.   Click the button at the lower right labeled 'Start Bulk Report Generation' to begin generating a report.  

time series chart Bulk Report labels

The report will be generated fairly quickly, and then the PDF created from the report will be opened with the default PDF viewer installed on your PC.   Click on the image below to open the PDF report generated.   Two statistical results (one per page) of 'Speed' and 'RPM' will be in the report, followed by a index of the source files from the search results.   Note that the Report panel is still shown/active, and you can explore each report page created.  

time series chart Bulk Report export to PDf file

You can customize the appearance of the report template, adding your own logo, and changing the formatting of the charts by following the steps in the tutorial How To Customize Report Templates.  

FAQ

Can I edit the report template and show the filenames on the 2D chart x-axis rather than the SourceFileHash?

Filename lengths vary from one data set to the other.   The use of the SourceFileHash and adding an index with a reference between SourceFileHash and the filename added at the end of the report is a compromise to insure report generation will be successful for everyone.  

How To Customize Report Layouts

Two methods exist for creating custom TSDMS report layout files.   The first method involves creating a search for files, opening a data file, and then opening a report layout file.   The first method lets you work with the actual data you intend to generate a report from in Bulk Report later.   However, if your data file has many data values within the channel (> 10k), then the report sheet refresh time may take very long.  

The second method is to use the menu option 'Settings','Edit Report layouts'.   This will create data 2D and 3D data in the Data Portal, and the channels will only have a small number of values, improving report refresh performance.   The images below show you how to access the second method options.  

TIP: When the Data Portal is visible, a toolbar button is added by the TSDMS to create sample 2D and 3D data.   You may use this anytime when working with report layouts.  

NI DIAdem report layout editing     NI DIAdem report layout editing

Regardless of what method you use for accessing channel data to edit a report layout, it is always best to clear out the chart curve channel references just prior to saving the report layout.   To do this, make sure the REPORT panel is active, then from the 'Settings' menu, choose 'Clear chart X,Y,Z references', and then save your report layout.  

Opening a Report Chart With Your Data

Create a Navigator search to show a set of files that you wish to generate a Bulk Report from.   Click on one of the search result items and then right click and select 'Load Data' from the pop-up menu.   The file selected will be loaded into the Data Portal, and then both the View and Report panels will be visible.  

Click on the 'Report' panel to activate it.  

NI DIAdem layout editing

Load a report template by selecting the menu option 'File', 'Open', and then choose the appropriate sub folder (BulkReportSinglePagePerFile), and then the template you wish to load.   For this tutorial, the report template named 'BulkReport_SPPF_portrait_1x2Dcht.TDR' in the folder '..\BulkReportSinglePagePerFile\' will be opened.  

NI DIAdem report layout editing

NI DIAdem report layout editing

IMPORTANT: You need to select the appropriate type of report template based on the type of Bulk Report you wish to use the revised template with.   Use templates in the folder named 'BulkReportSinglePagePerFile' only for the Bulk Report option 'Single Page Per File'.   Use templates in the folder named 'BulkReportDataSetSummary' only for the Bulk Report option Data Set Summary.   Additionally, never attempt to use the report templates named 'BulkReport_DSS_TblOfFiles_landscape.TDR' or 'BulkReport_DSS_TblOfFiles_portrait.TDR'.   Never attempt to update/overwrite the report templates that come with the TSDMS installation.   Instead, save them to a new file, within the appropriate folder.  

Do not delete any of the following report template objects named: Ch2DObj1, RptTitle, RptSubTitle, HeaderLeft, HeaderMiddle, HeaderRight FooterLeft, FooterMiddle, FooterRight, CommentsLeft or CommentsRight.   You can however change the formatting (font color, size, etc.) of any report object, and you may add new report objects to the page.   The primary objective in editing a report template is to change the formatting of a 2D or 3D chart.  

Changing 2D/3D Charts

The charts on the report page will not have any curves visible because the X,Y,Z references have been removed in order to insure good report generation performance.   In order to edit the formatting of a chart, you will need to assign X Channel, Y Channel, (and Z Channel if 3D chart) to the chart's x-axis, y-axis (and z-axis if a 3D chart).   In this example, a 2D chart is shown that supports displaying multiple curves on the same chart with a separate y-axis for each curve.   Find the channel group of interest and the Y Channels you wish to show on this report layout.   If you want to plot up to four curves on the chart, then first click on the X channel, then while holding the CTRL key, click on the four Y Channels in the Data Portal from within the same channel group.   Without moving the mouse pointer (already over the last channel you selected), release the CTRL key (the channels in the Data Portal should still be highlighted), and then drag and drop them on to the center of the 2D chart.  

NI DIAdem report layout time series chart editing

Whenever you drag and drop channesl to a 2D or 3D chart in DIAdem, you must always select the X Channel first, next the Y Channel(s).   If working with a 3D data structure, then you first select the X Channel, next the Y Channel, and the finally all of the Z Channels.

You can now see the chart curves since they have been assigned channel data from the Data Portal.   In the center of the chart, double click to open a DIAdme dialog that allows you to edit the chart.  

NI DIAdem report layout time series chart editing

The curves are showing lines and points (markers), causing the curve to have very fat lines because the markers are stacked on top of each other.   We are going to disable the display of the points (markers) for each curve.   From the 'Curve List' tab, you can see the four curves listed.   Click on the second curve 'Type' (second row labeled '2' and under the column labeled 'Type') to see a dialog that will allow you to change the type from 'Line and points' to 'Line'.   Click the 'Preview' button to see the effect on the report chart.   Then click 'OK' for that dialog, and 'OK' for the previous dialog.   Repeat this process for the remaining three curves.   Note that you could also change the curve line color, style, etc.   Explore the options available from the 'Axis System', 'Axis Position', and 'Axis Parameters' tabs.  

report layout time series chart markers

Turn off the display of the grid by clicking on the menu option 'View' and then 'Grid'.   When the curves have been edited properly, they will appear as shown below. Save the template to a new filename, in the proper folder for the type of Bulk Report you intend to use it for.  

report layout turn off grid

Before saving the report layout, you should remove the X,Y,Z channel references from each curve.   This will dramatically improve the redraw performance of the layout when used later with channels that have many data values (10k or more).   In the REPORT panel, under the menu 'Settings' is an option 'Clear chart X,Y,Z channel references' that will do this for you.  

You now know how to create customized report templates.   Using Bulk Report, you can easily generate a report from thousands of files that includes metadata from those files, and with the report formatted to your needs.  

Adding a Logo to a Report Layout

Click on the Report panel toolbar graphic/image icon and choose 'Load Graphic'.   Browse for the image of the logo you wish to add to the report.   You may choose graphic files with .png, .jpg, .jpeg, .gif, .tif, .emp, or .bmp file extension.  

DIAdem report layout add graphic logo

Drag the image object to the location on the report where you wish it to appear.   You may also expand or shrink it's size by grabbing and dragging a corner.  

DIAdem report layout format logo image

IMPORTANT: Embed the image into the report so that the image you loaded doesn't need to exist.   Right click on the image and choose the option 'Settings'.  

DIAdem report layout embed logo picture

Click the checkbox labeled 'Embed graphic in layout when saving'.   Click 'Apply', and then save the report template.  

DIAdem report layout embedded logo save

A Caution About Report Layout Editing

You should always begin creating a custom report layout from one of the original files that came with the installation, or file that you editied that came from the original installation files.   Bulk Report expects and requires that certain chart and text objects exist on the report layout.   Specifically, it expects to see these object names: RptTitle, RptSubTitle, Ch2Dobj1, CommentsLeft, CommentsRight, HeaderLeft, HeaderMiddle, HeaderRight, FooterLeft, FooterMiddle, and FooterRight.  


TSDMS Requirements

  • NI DIAdem version 2021 or later Advanced or Professional edition
  • Windows 10 64-bit or Windows Server 2016 64-bit (a DIAdem 2021 requirement)
  • Read and write access to the DataFinder search area folder (user selected during TSDMS installation)
  • Read and write access to the Windows TEMP folder
  • Read and write access to the user's AppData local folder
  • Read and write access to the folder with raw data files to be imported using Bulk Import
  • You must accept the TSDMS End User License Agreement (EULA)

TSDMS Limitations

  • Currently only supports 'My DataFinder' that ships with DIAdem. However, the framework to support any DataFinder is built into the software and it can be expanded to provide this capability without major revisions.  
  • DataStore is not supported
  • Search results as files/elements is limited to 32000 files.   Search results as properties is limited to 2.5E6 items.  

TSDMS Standards

Properties

Every file imported by Bulk Import will have the file/root properties listed below added to the TDMS file.   These property values can be used by Search by Metadata to identify a set of files based on those imported together (ImportBatchHash), the date imported (Date_Imported), and the date the raw data file was recorded (Date_Recorded).  

  • SourceFileHash - a hash calculated on the raw data source file.
  • ImportBatchHash - a hash calculated on the date/time the files were imported by Bulk Import.   All files in the set imported will have the same ImportBatchHash value.
  • DateTimeOffsetFromUTC -The offset between local time and UTC for all dates in the data file.   Formatted as +/-hh:mm where hh is the hours, and mm is the minutes.   A value of "-00.00" means the time zone is unknown.   Supplied by the user in Bulk Import.   Also applies to channels.  
  • Date_Imported - The date the set of files were imported by Bulk Import.
  • Date_Recorded - The date the file was recorded.   The source of this date varies, depending on if a date stamp was identified from the filename, and/or if a valid date was found within the contents of the file.   Unfortunately the time zone or offset from UTC is rarely known.  
  • ImportUserName - The Windows USERNAME at the time Bulk Import was executed.
  • ImportComputerName - The Windows COMPUTERNAME at the time Bulk Import was executed.

Channels

Both 2D and 3D channel structures may have channel groups with text/string channels, assignment channels, video channels, and complex channels.   Y-Channels are typically numeric, but they may also be implicit channels or calculation channels.   Waveform channels are always converted by the TSDMS into numeric X and Y channels.   Numeric channels are preferred over waveform channels because waveform channels don't support non-linear 'Time' channels (frequency), and some DIAdem analysis tools operate faster and cleaner with numeric channels as the input.  

2D   (X-Y)

A 2D data structure consists of an x-channel and y-channel(s) with the same number of values in the X and Y channels.   The most common configuration is one x-channel, and one or more y-channels within the same channel group.   It is also possible to have pairs of X and Y channels within the same channel group.  

The x-channel is always linear and the values are equidistant.   The values may consist of numeric values, or values of type date/time (DIAdem documentation calls this a channel of type 'Time').   The TSDMS preference is to name numeric x-channels 'Time' and date/time x-channels 'DateTime' whenever either is created.   DateTime x-channels may be high resolution for absolute time values.   DateTime channel time values are ambiguous unless the time zone associated with the values is known.   If the TSDMS is able to infer a time zone from the data, then the channel property named "UTC_offset" with a data type of text/string will be added to the DateTime channel.   The value will be "+00:00" for UTC, formatted as "+hh:mm" for a known time zone offset, or "-00:00" (or absent) when the time zone is unknown.   A numeric Time channel will always be created by the TSDMS if absent, but DateTime channel will only exist if it is included with the raw data, or created by the TSDMS if a time zone reference can be inferred.  

The association between a y-channel(s) and an x-channel (known as "XRelation") will be set automatically by the TSDMS for numeric X and Y channels.   It will typically referrence the Time channel, rather than the DateTime channel, unless a time zone is known for the 'DateTime' channels.   This assignment makes it easier to manually generate View and Report plots.  

3D   (X-Y-Z)

DIAdem supports both triplet and matrix 3D (x-y-z) data structures.   Tools are included in DIAdem to convert between the two 3D data structure types.   Matrix structures are more commonly accepted for the Report panel 3D charting.  

The TSDMS standard is a matrix data structure.   A matrix consists of one numeric x-channel, one numeric y-channel, and multiple numeric z-channels.   One z-channel for each value in the y channel, and the number of values in each z-channel corresponds to the length of the x-channel.

Channel Table of Matrix Data Structure
X Y Z1 Z2 Z3
0.1 10.0 100.0 110.0 120.0
0.2 20.0 105.0 115.0 125.0
  30.0      

TSDMS Installation

The TSDMS installation comes in the form of a .zip compressed archive file.   This file format is suppored in Microsoft Windows 10 (using File Explorer, right click on the .zip file).   Many other free and paid .zip utilities for Windows exist and may be used.  

The installation is intended to be minimally invasive in terms of the impact on the existing installation of DIAdem.   After installation of the TSDMS, you may freely switch between using DIAdem (without the TSDMS features), and running the TSDMS, by choosing between two Windows menu shortcuts.   No changes will actually be made to your installation of DIAdem, except for the addition of a new DIAdem desktop file in the user's AppData folder (C:\Users\YourName\AppData\Local\National Instruments\DIAdem\2021\).   The DIAdem desktop file created will be named 'TSDMS.DDD' and it will configure DIAdem to run the encrypted code extracted from the 'TSDMS.ZIP' file.   The installation will create a Windows menu shortcut named 'shortcut TSDMS' that will launch DIAdem with the 'TSDMS.DDD' desktop file.   If after installation you run DIAdem using the Windows shortcut for DIAdem, it will appear just as before, without any evidence of the TSDMS.   The Windows shortcut 'shortcut TSDMS' is the only way to run the TSDMS app.   Note also that the files imported by the TSDMS will reside in a folder compeletely separate from the original DIAdem installation.   Do not attempt to configure the TSDMS to use any existing DIAdem search folder.   Although the .TDMS files share the same filename extension, the TSDMS structures the data and tags it in a particular way to provide all of the enhancements enjoyed while using the TSDMS.  

Place the TSDMS.ZIP file into a temporary empty folder where you have write permissions and extract the entire .zip archive.   You should see a 'install.VBS' file, and then several subfolders, named 'code', 'install', 'logs', 'raw_data', 'results', 'TDM_DF_indexed', 'TDM_files_new', and 'templates'.  

Before going any further, decide where you want the TSDMS installation to reside, and where you want the imported files (saved as .TDMS) to be stored.   By default, the installation will place the < 30 MB of code and templates into a folder named 'DIAdem_TDMS' right off your user's 'Documents' folder.   The default location for the imported .TDMS file is a folder name 'TDM_DF_indexed' as a sub folder of 'DIAdem_TDMS' (later, it will be a search area named 'IndexPathTdmFilesLoca' in DIAdem).   For the best performance, the 'TDM_DF_indexed' should be on the fastest drive that is connected to your PC, and you must have read/write access to this drive.   It is strongly discouraged designating this folder on any shared network drive because performance will suffer.   Consider also that if you are importing many gigabytes of raw data files, the size of the files in 'TDM_DF_indexed' will grow in proportion.   Do not attempt to configure the TSDMS to use any existing DIAdem search folder.   For more information about system configuration options, see System Configuration Options  

Run your installation of DIAdem, click on the SCRIPT panel, and then fron the 'File' menu choose 'Open' and select the install.VBS file.   Click the F5 key or the tool bar 'Run Script' button to run the 'install.VBS' script.  

System Configuration Options

Many options exist regarding where the application (DIAdem + TSDMS) is run (locally, or on a remote virtual machine), where the imported data is stored (locally, or on a remote server),

The performance of any data management is dominated by the import of raw data files, and the subsequent analysis of those data files.   Importing raw data files should be performed with the highest possible speed connection between the media device that holds the raw data files, and the computer that will perform the importing.   Raw data files from 100 MB to gigabytes each will NOT transfer quickly over WiFi, cellular, or over any network with a substantial distance between the source and destination nodes (see Transferring Big Data Across Geo-Distributed Locations).   Similarly, you cannot read/write large data files quickly over WiFi, cellular, or between network nodes separated by a substantial distance.  

Standalone System

A single fast computer that has DIAdem and the TSDMS installed, and one that will be able to physically locally connect to raw data files, will achieve superior performance over any other configuration.   The disadvantage of this system is that it lacks the ability to share the imported data with other users.  

Remote Controlled Server

A server that permits users to remotely login and take control of a virtual PC can achieve acceptable data analysis performance.   The remote control experience will be degraded by the speed of the network between the remote user and the server, and further by the distance between them due to latency.   If the raw data is physically shipped from distant locations to the server's location and then the data is locally imported using a PC directly connected to the server, then very high speed data import performance can be achieved.   Note that centrally controlling data import also has significant security advantages.  

Local Client Remote Network Storage

A system where users locally run the application, and that software accesses the imported data stored on a central but remote server, will perform adequately only if the network connection is very high speed, and the distance between the client and the server is not excessive.   Importing the raw data files locally at the client will only achieve acceptable performance if the network connection between the user and the network storage device has the same performace as if it was stored locally (typically unlikely).   If however, the poor performance of data import can be accepted, the advantages of multiple users having access to a central imported data storage location can be high to the organization.  

FAQ

What is 'My DataFinder' and what is a DataFinder?

A DataFinder is an indexing service that creates a database of the metadata and file contents (filename, channel group name, channel name).   The DIAdem Navigator interface connects to a DataFinder and allows you to perform a search of the database, allowing you to find files, channel groups, and channels of interest based on your search criteria.   The DataFinder 'My DataFinder' is a local DataFinder that supports a standalone installation of DIAdem on a user's PC, and the indexing of files on that user's PC.  


TSDMS Road Map

TSDMS Feature Road Map
Version Timing Features
0.0.x 2022
  • A complete integrated solution for the import, analysis, and report generation from multiple files via Bulk Import, Bulk Analysis, and Bulk Report.  
  • DataFinder support for 'My DataFinder' only)
  • Bulk Analysis of 2D and 3D channel statistics
0.1.x TBD
Bulk Analysis
  • FFT - Fast Fourier Transform
  • Time-At-Level histogram
  • Channel smoothing (noise filtering)
0.2.x TBD
Bulk Analysis
  • Attribute data files with ambient weather conditions based on date/time and GPS coordinates.
  • Cyclic data analysis plus linearity, hysteresis, repeatability, and accuracy calculations
0.3.x TBD
  • Filter file search results by channel events
  • Channel spike / outlier management
  • Synchronize channels
  • GPS tool
0.4.x TBD
  • Concatenate files
  • Split files by day
  • Split files by channel event
0.5.x TBD
  • Bulk Import optimizations by DataPlugin

The exact release content and schedule is subject to change based on user demand and other considerations.  

Getting Started

The Time Series Data Management System (TSDMS) requires the installation of NI DIAdem.   The configuration of DIAdem can be setup in several ways with respect to where / how the application is accessed, and the data is stored (see System Configuration Options).   The most simple configuration is a standalone setup with DIAdem installed on a PC, and the imported files residing on a local hard drive, indexed by DIAdem's 'My DataFinder'.   A DIAdem installation automatically configures 'My DataFinder', as does the TSDMS for it's needs.  

Download the Always Free Version 0.0x, and follow the simple installation instructions.   Then generate some sample raw data files using the TSDMS menu option.   Perform a Bulk Import on the sample raw data files, taking care to extract metadata from the filename and folder as detailed in the Step by Step Guide.  

Execute a Search by Metadata to generate search results consisting of a set of files to be analyzed.   Perform a Bulk Analysis on the search results, followed by a Single Page Per File Bulk Report.  

Watch a Video


Time Series Data

Measurement data recorded from one or more sensors by a data logger or recorder.   It is typically time series and a time or date/time stamp is associated with every measurement value.   Metadata such as the engineering units (°F, millimeters, ft/sec, etc.), location (GPS latitude & longitude), operating conditions, environment, etc. provide important context.  

Example of Time Series Data

Time [sec] Date/Time [UTC] Latitude Longitude Temperature [°F] Humidity [%]
0.0 20210530T14:43:02.5678 40.440488 -76.122757 74.2 29.5
0.001 20210530T14:43:03.2358 40.440498 -76.122761 74.3 29.4
0.0015 20210530T14:43:04.1353 40.440489 -76.122759 74.3 30.0

The above was recorded by a custom data logger S/N APC23467 outside at Bernville, PA USA from a Cub Cadet Ultima ZT1 lawn mower at an elevation of 362 ft.  

Data Structures

A 2D data structure consists of an x-channel and y-channel(s) with the same number of values in the X and Y channels.   The most common configuration is one x-channel, and one or more y-channels within the same channel group.   It is also possible to have pairs of X and Y channels within the same channel group.   Waveform channels contain both the X and Y parts within the same channel.  

DIAdem supports both triplet and matrix 3D (x-y-z) data structures.   Tools are included in DIAdem to convert between the two 3D data structure types.   Matrix structures are more commonly accepted for the Report panel 3D charting.  

A matrix consists of one numeric x-channel, one numeric y-channel, and multiple numeric z-channels.   One z-channel for each value in the y channel, and the number of values in each z-channel corresponds to the length of the x-channel.

A triplet consists of three data channels of the same length (number of rows/samples), one each x-channel, y-channel, and z-channel.  

Miscellaneous

DIAdem   is data management software from NI for measurement data aggregation, inspection, analysis, and reporting.  

DataFinder   A search engine for TDMS files.   The metadata and content of TDMS files are indexed and then the DataFinder provides tools that allow you to quickly review and search file content based on the metadata.   A DataFinder is an indexing service that creates a database of the metadata and file contents (filename, channel group name, channel name).   The DIAdem Navigator interface connects to a DataFinder and allows you to perform a search of the database, allowing you to find files, channel groups, and channels of interest based on your search criteria.   The DataFinder 'My DataFinder' is a local DataFinder that supports a standalone installation of DIAdem on a user's PC, and the indexing of files on that user's PC.  

Hash   A hash is a unique identifier for a file, or other type of digital content.   You can compare the hash calculated on two files to determine if those files have exactly the same content.  

Metadata   Metadata is data about data.   It is information that provides context for data.   Sensor data that has recorded an event has more context when you include metadata that describes where the data was recorded, with what equipment, and under what conditions.   Metadata stored in a TDMS file and operated on in the DIAdem environment is called properties.   Properties are key/value pairs, where you have a property name, and it then has several values.   The property named 'Latitude' could have many numeric values between +90.0 and -90.0.   A property named 'DaqDevice' could have text values such as 'eDAQ', 'DeweSoft', 'Vector', 'CANedge2', 'cRIO', 'Telemaco', etc.   Properties that all have the same data type (text, numeric, date/time) can be indexed by DIAdem's DataFinder and then you can perform a search for files, channel groups, and channels based on the property names and it's values.  

TDMS (file)   A binary file with a .tdms file extension that is formatted according to the National Instruments (NI) Technical Data Management Streaming (TDMS) specification.   The format of the file follows the TDM Data Model, is an open standard, is very well documented, and API's are also available to enable custom development with the file format.   The structure of the file provides superior performance for the reading and writing of time series measurement data.   Metadata (root, channel group, and channel properties) are stored within the file.  

TDM Data Model   The NI TDM Data Model organizes imported data into a root element, channel groups, and channels.   DIAdem standard and user created custom properties are/may be added to the root, channel group, and channel.  

Channel Group   A channel group organizes one or more channels into a group.  

Channel   DIAdem stores data in channels.  

Numeric Channel   These channels only hold numeric values.  

Waveform Channel   Both the X and Y values are stored within the channel.   The X values must be linear.  

Text Channel   Channels that hold text or string values.  

Assignment Channel   Numeric or waveform channels that connect specific values or values ranges with text values.  

Implicit Channel   The values are generated through a linear specification (rather than individual values).  

Calculation Channel   The values in the channel are derived from a formula that typically reference one or more channels and constants.  

Complex Channel   The real and imaginary values are alternatively stored in a channel.  

Video Channel   Contains reference information to an external video file.  

Channel Row   A specific location or position of a sample within a channel.   The position or row is counted beginning at one.  

Channel Length/Size   The number of samples or values stored in a channel.  

X Channel   a channel associated with a Y Channel, and where appropriate a Z Channel.   It may consist of a numeric channel of linear and sequential time values, or non-linear frequency values.   It may also be formatted as linear and sequential Date/Time values.   DateTime Channel

Y Channel   Associated with an X Channel and when the data structure is 3D, one or more Z Channels.   Channel types include numeric, waveform, text, assignment, implicit, and calculation.  

Z Channel   is always part of a 3D (x-y-z) data structure.   Within the context of the TSDMS, it will always be a matrix data structure.   Outside of the TSDMS, it could be a triplet data structure.  

Properties   DIAdem's name for Metadata.  

ASAM   Association for Standardization of Automation and measuring Systems.  

ASAM ODS   ODS is a test data management standard developed by ASAM.   It was created to simplify the universal interpretation of test data.   NI ASAM ODS tutorial.  


DIAdem Core Features

NI DIAdem is a comprehensive software application designed to import, organize, visually analyze, numerically analyze, and generate custom visualizations from data acquisition data.   It provides a complete solution for the management of Big Data.   It can also be easy extended to support a multi user environement where the data is shared by installing and configuring a DataFinder server to provide a single location and service to connect to imported data across an organization.  

The graphical user interface (GUI) is organized by task.   The Navigator panel allows you to import raw data, connect to an indexing service such as DataFinder, and to search for data.   The Data Portal provides a means to interact with imported data that has been loaded into memory.   The View panel has tools to enable you to interactively visualize data loaded into the Data Portal.   The Analysis panel provides hundreds of engineering and scientific analysis functions for manipulation, calculation, and analysis of data.   The Report panel has a powerful user interface that quickly generates custom visualizations of the analyzed data, and supports exporting report pages to common external document formats.   The Script panel allows you to automate repetitive tasks.  

Navigator

The DIAdem NAVIGATOR is used to import raw data, connect to an indexing service such as DataFinder so the metadata and content imported can be searched, and facilitates loading the data into memory (Data Portal).   DataPlugins are available to support the importing of hundreds of different raw data file formats.   Imported data is saved to the TDM or TDMS file format and then indexed by a DataFinder.   The NAVIGATOR user interface provides the means to search the DataFinder index to identify data of interest by metadata at the file/root, channel group, or channel level.   Search results may then be loaded into memory and viewed with the Data Portal.  

Data Portal

You interact with data loaded into memory by the NAVIGATOR using the Data Portal.   The imported data is structured to conform to the TDM Data Model that organizes data into a root, channel group, and channels.   The other DIAdem panels such as ANALYSIS, VIEW, and REPORT access data via the Data Portal.  

Any metadata added to a TDM/TDMS file at the root, channel group, or channel can be inspected.   You may also add and edit root, channel group, and channel metadata.   DIAdem calls this metadata 'properties'.  

DIAdem supports different types of channels, including numeric, waveform, date/time, text, video, calculation, assignment, and complex.   2D and 3D data structures are supported by DIAdem.   2D data structures typically consist of a X Channel and one or more Y Channels.   3D data structures may be in the form of a matrix or a triplet.  

The engineering units for a channel may be configured by accessing the Units Catalog.   You use the Units Catalog to assign an existing, or create a new unit to be assigned to a channel.  

Raw data files imported by the NAVIGATOR are saved to a binary file as either a TDM (.tdm file extension) or TDMS (.tdms) file.  

View

The DIAdem VIEW panel allows you to visually inspect and graphically analyze data loaded into the Data Portal.   Channel Tables allow you to see the contents of channel individual values in tabular format.   The 2D Axis System enables inspection of plotted channel data.   The layout in VIEW is flexable, allowing you to view a channel table in one section, and one or more 2D Axis System plots in an other.   Other types of interactive visualization tools are available, including Bode, Polar, Orbit, Shaft Centerline, Birds Eye View, Contour, Cascade, Map, Graphic, Video, and Textbox, depending on the type of channel you have.  

If video was recorded simultaneously with data, you can use VIEW to interactively inspect the data and visually see the video content at that point in time.   Videos and data are synchronized using the data time channel, and the time reference data in the video.  

Analysis

The ANALYSIS panel allows you to perform analysis on the data loaded into the Data Portal (memory).   Dialogs assist you in setting up and performing an extensive scope of standard mathemtical functions for data analysis.   These mathemtical functions are organized into groups named: Basic Mathematical, Channel Calculations, Curve Fitting, Signal Analysis, Statistical and Classification, 3D Analysis, and Crash Analysis.   The DIAdem Calculator allows you to define your own custom formula based functions.   The Calculation Manager will allow you to define a set of calculations to execute where the output from one calculation may be passed as input to the next calculation.  

Report

Generate a custom report that documents data and results using the DIAdem REPORT panel.   You can use any combination of 2D/3D chart axis system, tables, text, and graphic objects in a report.   You may generate multiple pages in the report, but each page must connect to data currently in the Data Portal.   Report pages from multiple files can be accomplished by exporting the data to a PDF file for example, and manually appending it from REPORT sequentially from each file.   Report templates may be created with custom layouts, logos, and formats to support easier generation of routine reports.  

Script

Automate repetitive tasks by programmatically accessing any of the tools accessible via the DIAdem graphical user interface(GUI).   The script recorder allows you to record manual operation of the GUI, and then with a few adjustments that script can be used to fully automate the task.   Create custom dialogs with embedded interactive controls for interactive analysis, visualization, and report generation.  


Copyright © 2021,2022 Mechatronic Solutions LLC, All Rights Reserved