Time Series Data Management System

A software application that dramatically simplifies the management, analysis, and visualization of time series data.   It is optimized to ingest, search, analyze, and visualize big data from nearly any file format and data structure.  


Time Series Data Management System app for big data analytics & visualization


Powerful Intuitive User Interface

This application has been designed to be so intuitive, you will be analyzing your data and generating reports in a very short time.   The ingestion, data analysis, and reporting tools support Bulk Operations, allowing you to process thousands of files of the same data structure in one session.  

See Video Example


Analytics performed on many time series data files


Powered by National Instruments DIAdem

No application is faster and more versatile than DIAdem for ingesting and analyzing big data from sensors and data acquisition equipment.   It's open standard TDMS file format provides superior read/write performance, and it stores metadata that provides valuable context, and is the enabler for data categorization.  

Already a DIAdem user?   This application will accelerate your data processing productivity by making it possible to ingest, analyze, and generate reports for thousands of files in one batch.   The full capabilities of DIAdem are always one mouse click away from becoming visible in the user interface.  

Learn More


TSDMS is powered by NI DIAdem


Bulk Processing

  • Import many (thousands) of files of any type and size in one batch, and easily add metadata to them so they may be categorized.  
  • Search your data files by metadata, building a set of search results that may be used as input to Bulk Analysis and Bulk Report.
  • Easily perform channel statistical analysis on a set of data files using Bulk Analysis.
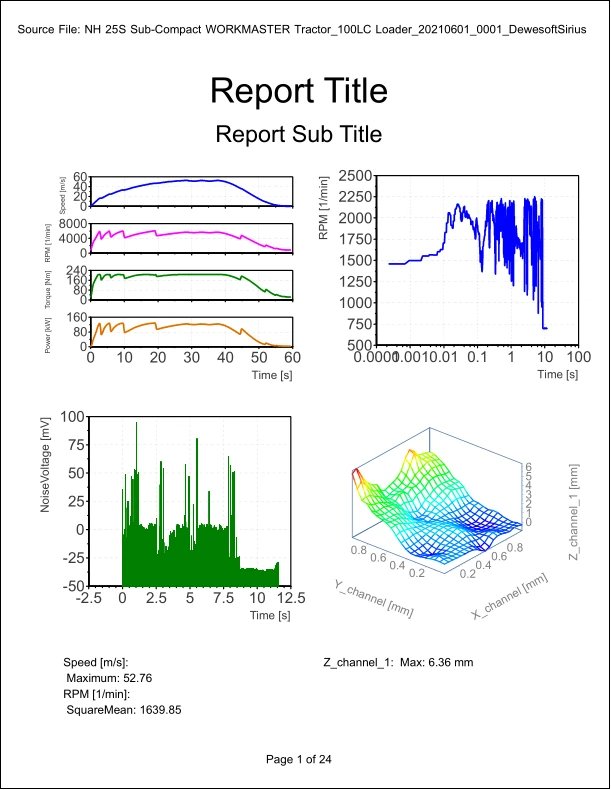
  • Generate a custom report with charts and data analysis results from a batch of imported data files using Bulk Report.   Create a data set summary of a set of files, extracting channel statistical results from each file, plotting those values to a chart, and then calculating statistics on those extracted values and adding that value to the report.  

See It In Action


Visualization report of analytics from thousands of time series data files


Copyright © 2021,2022 Mechatronic Solutions LLC, All Rights Reserved